What Technology’s Correction Means

The recent correction in the S&P 500 Index’s technology sector presents a unique challenge to markets following a historic stretch of outperformance as technology’s share of the market has ballooned in size. Despite September weakness in this sector that has dragged the broader market lower, we expect technology leadership to continue given supportive underlying fundamental and technical conditions.
A September to Forget
During the COVID-19 pandemic, technology has played a curious role in mitigating downside during bouts of volatility, while also posting considerable outperformance when markets rebounded, as many viewed the sector as relatively well insulated from the economic effects of the virus. After a “melt-up” environment for tech during the month of August, the sector so far has corrected more than 12% from its prior high in September, a historically weak month for the S&P 500. Investors are asking if the weakness will continue.
Fundamentals are Supportive
The question of whether technology’s strong performance since March has put it in bubble territory has received a lot of attention in the financial media as well as with investors. Although we acknowledge that some of the better-performing technology and technology-related stocks have been on an upward trajectory similar to that of the late 1990s until the recent sell-off, we don’t believe technology is in a bubble.
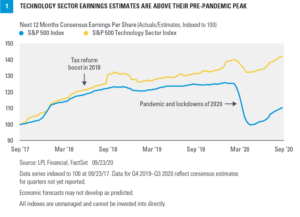
We would first point out how strong fundamentals are right now. Earnings estimates for the sector have already moved above their pre-pandemic highs. While there is risk that these expectations may not be achieved, the gap between technology sector earnings and earnings from the entire S&P 500—which includes technology—is impressive [Figure 1].

During the second quarter of 2020, technology was one of only three sectors to produce earnings growth—along with healthcare and utilities—in a quarter in which S&P 500 earnings fell 32% year over year. For 2020, consensus estimates are calling for 5% earnings growth for the sector, which would be the best among all 11 S&P 500 sectors (source: FactSet).
We believe these earnings justify the sector’s premium valuation. The technology sector is trading at a price-to-earnings (PE) ratio of about 24 times estimated 2021 earnings, which is roughly 22% above the broader S&P 500. With interest rates so low and earnings growth scarce, we believe this valuation is reasonable in absolute and relative terms. Historically, 20% premiums to the market’s PE have been typical for technology.
We understand the argument that the tailwinds the sector has enjoyed during the pandemic may fade, potentially limiting the sector’s growth opportunities from here. In a year, we may not be setting up as many home offices or buying so many devices for kids to learn remotely. If this causes earnings momentum in the sector to fade, technology stocks could be used as a source of funds to move into cyclical value stocks that have lagged. Nevertheless, while some of the trends driving the sector, such as cloud computing and e-commerce, may slow down once the pandemic is over, some of these behavioral changes may become structural and may not reverse.
We acknowledge that investing in the sector right now carries risks. In addition to the potential for the economic recovery to stall because of COVID-19, US-China tensions ratcheting higher and disrupting supply chains may present the biggest risk to the sector. Regulatory risk around antitrust and privacy concerns may be another potential consideration.
Tech Correction Should Prove Buyable
The S&P 500 Technology Sector Index has pulled back nearly 13% from its September 2 close through its closing low point as of September 25, putting the sector firmly in correction territory. However, from a technical analysis perspective, we believe that this correction was overdue and driven primarily by how stretched prices had become rather than due to internal deterioration or the beginning of a long-term rotation out of the sector. In fact, following an 11.8% gain in August and an 80% rally from the March lows, the sector was trading more than 31% above its 200-day moving average as of September 2, the most since April 2000.
Pullbacks in uptrends have historically represented opportunities, and this may be the case with the technology sector. Technology has represented the most consistent area of relative strength for the S&P 500, not just year to date, but for the past decade, and the recent decline does little to change that long-term picture.
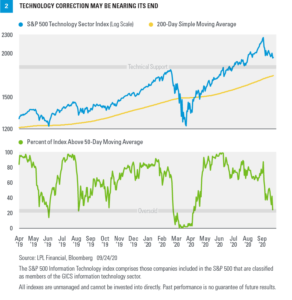
Data shows that we may be getting close to oversold conditions based on the percent of stocks in the sector trading above their 50-day moving average [Figure 2]. Historically, when that reading has moved as low as 20–25%, as it did multiple times during 2019, it has occurred close to a market bottom. That reading reached 23.6% the third week of September, meaning more than three out of four companies in the sector had broken below their trend lines.

Finally, the technology sector has substantial technical support at the February highs, and the rising 200-day moving average that currently sits just below that level. There is precedent for the sector stabilizing after retracing a move back to its 200-day moving average after being so far above it, but because the moving average calculation is rapidly rising, that support level may meet or exceed the February highs by the time prices move back to that level.
Conclusion
We certainly understand investors’ angst when previous outperformers correct, which some believe may be a precursor to a much worse environment for equities. However, we maintain our preference for the technology sector based on solid fundamentals and a still-bullish technical picture. While some rotation into other cyclical sectors may be a reassuring sign that markets are pricing in an end to the pandemic, we would view recent technology weakness as a buying opportunity and expect the sector to maintain leadership in the next leg of this bull market.
Read previous editions of Weekly Market Commentaryon lpl.com at News & Media.
Jeffrey Buchbinder, CFA, Equity Strategist, LPL Financial
Scott Brown, CMT, Senior Analyst, LPL Financial
Nick Pergakis, Analyst, LPL Financial
IMPORTANT DISCLOSURES
This material is for general information only and is not intended to provide specific advice or recommendations for any individual. There is no assurance that the views or strategies discussed are suitable for all investors or will yield positive outcomes. Investing involves risks including possible loss of principal. Any economic forecasts set forth may not develop as predicted and are subject to change.
References to markets, asset classes, and sectors are generally regarding the corresponding market index. Indexes are unmanaged statistical composites and cannot be invested into directly. Index performance is not indicative of the performance of any investment and do not reflect fees, expenses, or sales charges. All performance referenced is historical and is no guarantee of future results.
Any company names noted herein are for educational purposes only and not an indication of trading intent or a solicitation of their products or services. LPL Financial doesn’t provide research on individual equities.
All information is believed to be from reliable sources; however, LPL Financial makes no representation as to its completeness or accuracy.
US Treasuries may be considered “safe haven” investments but do carry some degree of risk including interest rate, credit, and market risk. Bonds are subject to market and interest rate risk if sold prior to maturity. Bond values will decline as interest rates rise and bonds are subject to availability and change in price.
The Standard & Poor’s 500 Index (S&P500) is a capitalization-weighted index of 500 stocks designed to measure performance of the broad domestic economy through changes in the aggregate market value of 500 stocks representing all major industries.
The PE ratio (price-to-earnings ratio) is a measure of the price paid for a share relative to the annual net income or profit earned by the firm per share. It is a financial ratio used for valuation: a higher PE ratio means that investors are paying more for each unit of net income, so the stock is more expensive compared to one with lower PE ratio.
Earnings per share (EPS) is the portion of a company’s profit allocated to each outstanding share of common stock. EPS serves as an indicator of a company’s profitability. Earnings per share is generally considered to be the single most important variable in determining a share’s price. It is also a major component used to calculate the price-to-earnings valuation ratio.
All index data from FactSet.
Please read the full Midyear Outlook 2020: The Trail to Recovery publication for additional description and disclosure.
This research material has been prepared by LPL Financial LLC.
Securities and advisory services offered through LPL Financial (LPL), a registered investment advisor and broker-dealer (member FINRA/SIPC). Insurance products are offered through LPL or its licensed affiliates. To the extent you are receiving investment advice from a separately registered independent investment advisor that is not an LPL affiliate, please note LPL makes no representation with respect to such entity.
| Not Insured by FDIC/NCUA or Any Other Government Agency | Not Bank/Credit Union Guaranteed | Not Bank/Credit Union Deposits or Obligations | May Lose Value |


