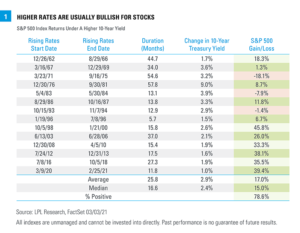
The 10-year Treasury yield continues to climb higher, but remains low by historical standards. Still, the size of the move since July 2020—and the more recent acceleration—has some market participants worried about the potential impact on stock markets if rates continue to rise. Historically, the S&P 500 Index has endured extended periods of rising rates well. If an improving growth outlook is part of what’s driving rates higher, it should also support corporate profits, creating a positive fundamental backdrop for stocks.
Rising Rates are Usually Bullish For Stocks
Bond yields have been on the move lately, but stock prices have also been rising. And while some market participants are expressing increased concern that rising bond yields may begin to weigh on stock returns, stocks have usually been resilient in rising rate environments. LPL Research looked at major extended periods of rising rates dating back to the early 1960s [Figure 1]. We found 13 periods in which the 10-year Treasury yield rose by at least 1.5%, a move the current increase hasn’t even reached yet. These rising-rate periods lasted between six months and almost five years, with the average a little over two years. In nearly 80% (10 of 13) of the prior periods, the S&P 500 Index posted gains as rates rose, as it has so far in the current rising-rate period. In fact, the average yearly gain for the index during the previous rising-rate periods, at 6.4%, is just a little lower than the historical average over the entire period of 7.1%, while rising rates have been particularly bullish for stocks since the mid-1990s. Not all rising-rate periods are the same, though, and we believe stocks may tolerate the current rising-rate period
Inflation Makes a Difference
How markets have performed during a rising-rate period has depended heavily on what’s going on in the economy, with inflation a leading consideration. Rising rates during periods of high inflation have generally resulted in lower stock returns, although the level at which inflation has become a headwind is well above what even most inflation hawks expect now. From 1968 to 1990, the Consumer Price Index (CPI) rose an average of 6.2% per year and was above 3.5% every year except three. Five of the rising rate periods in [Figure 1] took place at least partially during those inflationary years. The average annual return during those rising-rate periods was -0.4%. During all other rising-rate periods, the average annual return was 13.0%, well above the average for all returns since 1962. While inflation expectations are rising right now, CPI growth of even 2.5% at the end of the year would be an upside surprise based on the median estimate of Bloomberg-surveyed economists. For all the concerns about inflation, we are a long way from the ‘70s and ‘80s.
A Steepening Yield Curve Has Been a Good Sign
The yield curve is the difference between long-term and short-term interest rates. A steepening yield curve usually tells us two things: economic growth expectations are picking up, pushing long-term rates higher; and the Federal Reserve (Fed) probably is not yet pumping the brakes, helping to keep short-term rates relatively low, which usually also means inflation is under control. During the four rising-rate periods that saw the least yield curve steepening, as measured by the difference between 10-year and 3-month Treasury yields, S&P 500 Index returns were weaker than for a typical period, averaging an annualized 3.5%. In the four periods when the yield curve steepened the most, the S&P 500 averaged an annualized 14.5%. While yield curve steepening has not yet been dramatic enough to make its way into the top four periods historically, we have seen considerable steepening already. With the Fed likely on hold for some time, anchoring the short end of the curve, we expect that if rates continue to rise, it will come with further steepening. Some of that may be because of rising inflation expectations, but the main driver is likely to be an improved growth outlook.
The Starting Point Matters
Rates have been rising but they are still historically low, with the 10-year Treasury yield at the end of February falling into the bottom 2% of all values dating back to 1962. While it’s true that rates become a bigger burden for business, consumers, and governments as they rise, even at current and higher levels rates are still attractive and can continue to support a robust economic rebound. Looking back again at the different rising rate periods, during the four periods with the highest initial 10-year Treasury yield, the S&P 500 averaged a 2.5% annualized return, while those with the four lowest initial yields averaged 15.4%. A lower initial yield likely reflects manageable inflation and a Fed that isn’t tightening, but it also represents the added economic support of a still low cost of borrowing even as rates rise.
The Current Rising Rate Environment Looks Positive For Stocks
Rising interest rates have clearly been one of the reasons the S&P 500 has consolidated since hitting its last all-time high on February 12, but it’s important to look at the bigger picture. Rising rates in general have not prevented stocks from advancing and the current environment improves the odds that stocks will be able to continue to press higher. Rising rates are being driven in part by an improving growth outlook; inflation, while normalizing, is still well below levels that have historically disrupted markets; the Fed remains supportive; and borrowing costs are still historically quite low. Every market environment is unique, but taking our cues from history, the economic fundamentals continue to look strong and the current rising rate picture looks most similar to those periods of above-average stock performance. Read previous editions of Weekly Market Commentary on lpl.com at News & Media. Barry Gilbert, Ph.D., CFA, Asset Allocation Strategist, LPL Financial
Lawrence Gillum, CFA, Fixed income Strategist, LPL Financial ______________________________________________________________________________________________ IMPORTANT DISCLOSURES This material is for general information only and is not intended to provide specific advice or recommendations for any individual. There is no assurance that the views or strategies discussed are suitable for all investors or will yield positive outcomes. Investing involves risks including possible loss of principal. Any economic forecasts set forth may not develop as predicted and are subject to change. References to markets, asset classes, and sectors are generally regarding the corresponding market index. Indexes are unmanaged statistical composites and cannot be invested into directly. Index performance is not indicative of the performance of any investment and do not reflect fees, expenses, or sales charges. All performance referenced is historical and is no guarantee of future results. Any company names noted herein are for educational purposes only and not an indication of trading intent or a solicitation of their products or services. LPL Financial doesn’t provide research on individual equities. All information is believed to be from reliable sources; however, LPL Financial makes no representation as to its completeness or accuracy. US Treasuries may be considered “safe haven” investments but do carry some degree of risk including interest rate, credit, and market risk. Bonds are subject to market and interest rate risk if sold prior to maturity. Bond values will decline as interest rates rise and bonds are subject to availability and change in price. The Standard & Poor’s 500 Index (S&P500) is a capitalization-weighted index of 500 stocks designed to measure performance of the broad domestic economy through changes in the aggregate market value of 500 stocks representing all major industries. The PE ratio (price-to-earnings ratio) is a measure of the price paid for a share relative to the annual net income or profit earned by the firm per share. It is a financial ratio used for valuation: a higher PE ratio means that investors are paying more for each unit of net income, so the stock is more expensive compared to one with lower PE ratio. Earnings per share (EPS) is the portion of a company’s profit allocated to each outstanding share of common stock. EPS serves as an indicator of a company’s profitability. Earnings per share is generally considered to be the single most important variable in determining a share’s price. It is also a major component used to calculate the price-to-earnings valuation ratio. All index data from FactSet. Please read the full Outlook 2021: Powering Forward publication for additional description and disclosure. This research material has been prepared by LPL Financial LLC. Securities and advisory services offered through LPL Financial (LPL), a registered investment advisor and broker-dealer (member FINRA/SIPC). Insurance products are offered through LPL or its licensed affiliates. To the extent you are receiving investment advice from a separately registered independent investment advisor that is not an LPL affiliate, please note LPL makes no representation with respect to such entity. Not Insured by FDIC/NCUA or Any Other Government Agency | Not Bank/Credit Union Guaranteed | Not Bank/Credit Union Deposits or Obligations | May Lose Value
RES-674500-0321 | For Public Use | Tracking # 1-05119106 (Exp. 03/22)
Interest rates have risen steadily over the past six months but remain low by historical standards. That means the traditional high-quality bonds that many of us owned for decades are not doing the job for investors looking for income, while the potential for interest rates have risen steadily in recent months brings more risk in the bond market than has been evident historically. Here we look at some income ideas that may help with these challenges. When investors think about income, or yield, they would normally think bonds first. More on that below. Next they might think about getting extra yield from their stock portfolios, maybe with a dividend strategy that might be heavy on real estate investment trusts (REITs) and utilities. While we don’t have anything against using those types of strategies for a portion of a portfolio to get some yield, they can also carry unwanted interest rate sensitivity if rates rise. We highlight some equity income ideas that we would expect to perform well in a rising rate environment for you to consider when building your portfolio.
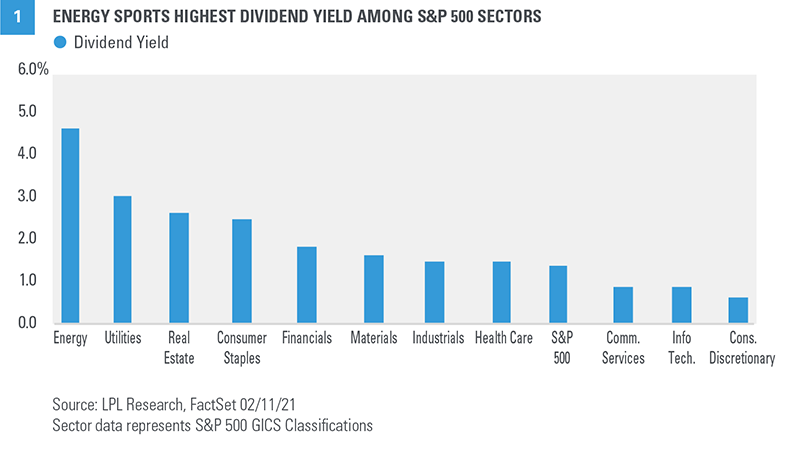
Income Idea #1: Energy
The first idea is energy stocks. You may be surprised to learn that the energy sector currently yields about 5% based on dividends paid in 2020, topping all S&P 500 sectors [FIGURE 1]. In this month’s Global Portfolio Strategy report, we upgraded our view of the energy sector to neutral. Our increased optimism was driven primarily by three factors. First, as we get closer to a fully reopened economy and travel activity picks up—potentially in the second half of this year—energy is likely to be a big beneficiary. Second, our technical analysis work revealed attractive upside potential based on recent price appreciation after an extended period of weakness. Third, we see the sector as attractively valued, especially when considering the income potential.
Keep in mind that dividends can be cut, so this investment is not without risk. Oil prices can be volatile, and alternative energy is gaining market share. So this may be more of a medium-term trade than a long-term investment. That said, we believe the chances are good that oil prices at least hold steady in the $55--60 per barrel range this year, sufficient for the sector to maintain rich yields while potentially seeing some additional price appreciation—on top of the 17% year-to-date gain.
Income Idea #2: Banks
You may be surprised to see banks on here as another income idea. The financials sector, which we upgraded in our January Global Portfolio Strategy report, carries a dividend yield of 1.9%, but banks yield 2.6%, based on the S&P 500 Bank Index. Although plenty of bond strategies carry yields in that range or higher, banks do not bring the interest rate risk that bonds do. Historically, bank stocks have exhibited positive correlation to interest rates (the stocks have tended to outperform as yields have risen). Bank stocks also tend to like a steepening yield curve—long-term interest rates rise faster than short-term rates—which we expect to see over the balance of 2021 as the economic recovery gains steam. We also expect bank dividend payouts to rise over the next year or two as the Federal Reserve eases up on payout restrictions. More progress on vaccine distribution should also enable a fully re-opened economy and drive stronger economic growth, which should bode well for the profitability and, therefore, dividend payout potential for the financials sector. Yields from banks may not look great on the surface—certainly not compared to the energy sector or some of the higher yielding segments of the bond market. But in a low rate environment with rates more likely to rise than fall, in our view, we think banks can make sense for income oriented investors with an eye toward total return.
Income Idea #3: Bank Loans
There are a number of fixed income options that may be suitable for income-oriented investors. For investors looking to limit interest rate risk, we believe bank loans, which we upgraded this month, may be an attractive option due to the improving economic environment and limited rate sensitivity (see our February Global Portfolio Strategy report for more details). [FIGURE 2] ranks the major fixed income sectors by income per unit of interest rate risk. Since fixed income indexes have different degrees of interest rate sensitivity, this exercise allows us to determine compensation for taking on interest rate risk. Bank loans are an obvious standout by this measure, offering potential yields in the 4% range with extremely low interest rate sensitivity. While the actual yield bank loans may offer in the future is not certain, this analysis does show that bank loans provide an attractive income option relative to other fixed income alternatives for investors looking to limit interest rate risk at the beginning of a possible rising rate cycle. It’s important to understand the trade-off between interest risk and credit risk. We know there is no such thing as a free lunch. That additional income compensation comes with assuming credit risk (the risk of a default or credit downgrade) and the risk that prices drop sharply in a risk-off environment if demand suddenly dries up.
Conclusion
Yields across much of the fixed income market are low, which leads us to increasingly look to the equity market for additional income. Our preference for stocks over bonds—supported by low interest rates—is one of our highest conviction recommendations for 2021. Several segments of the equity market—particularly the energy sector and banks—offer higher yields than traditional high-quality bonds and offer attractive capital appreciation potential as interest rates rise. For suitable fixed income investors looking for yield and concerned about rising rates, we believe now is a good time to give bank loans a look. Read previous editions of Weekly Market Commentary on lpl.com at News & Media. Jeffrey Buchbinder, CFA, Equity Strategist, LPL Financial
Lawrence Gillum, CFA, Fixed Income Strategist, LPL Financial ______________________________________________________________________________________________ IMPORTANT DISCLOSURES This material is for general information only and is not intended to provide specific advice or recommendations for any individual. There is no assurance that the views or strategies discussed are suitable for all investors or will yield positive outcomes. Investing involves risks including possible loss of principal. Any economic forecasts set forth may not develop as predicted and are subject to change. References to markets, asset classes, and sectors are generally regarding the corresponding market index. Indexes are unmanaged statistical composites and cannot be invested into directly. Index performance is not indicative of the performance of any investment and do not reflect fees, expenses, or sales charges. All performance referenced is historical and is no guarantee of future results. Any company names noted herein are for educational purposes only and not an indication of trading intent or a solicitation of their products or services. LPL Financial doesn’t provide research on individual equities. All information is believed to be from reliable sources; however, LPL Financial makes no representation as to its completeness or accuracy. US Treasuries may be considered “safe haven” investments but do carry some degree of risk including interest rate, credit, and market risk. Bonds are subject to market and interest rate risk if sold prior to maturity. Bond values will decline as interest rates rise and bonds are subject to availability and change in price. The Standard & Poor’s 500 Index (S&P500) is a capitalization-weighted index of 500 stocks designed to measure performance of the broad domestic economy through changes in the aggregate market value of 500 stocks representing all major industries. The PE ratio (price-to-earnings ratio) is a measure of the price paid for a share relative to the annual net income or profit earned by the firm per share. It is a financial ratio used for valuation: a higher PE ratio means that investors are paying more for each unit of net income, so the stock is more expensive compared to one with lower PE ratio. Earnings per share (EPS) is the portion of a company’s profit allocated to each outstanding share of common stock. EPS serves as an indicator of a company’s profitability. Earnings per share is generally considered to be the single most important variable in determining a share’s price. It is also a major component used to calculate the price-to-earnings valuation ratio. All index data from FactSet. Please read the full Outlook 2021: Powering Forward publication for additional description and disclosure. This research material has been prepared by LPL Financial LLC. Securities and advisory services offered through LPL Financial (LPL), a registered investment advisor and broker-dealer (member FINRA/SIPC). Insurance products are offered through LPL or its licensed affiliates. To the extent you are receiving investment advice from a separately registered independent investment advisor that is not an LPL affiliate, please note LPL makes no representation with respect to such entity. Not Insured by FDIC/NCUA or Any Other Government Agency | Not Bank/Credit Union Guaranteed | Not Bank/Credit Union Deposits or Obligations | May Lose Value
RES-658604-0221 | For Public Use | Tracking # 1-05111346 (Exp. 02/22)
Small caps have had an incredible run since the Russell 2000 Index bottomed on March 18, 2020, returning 119% compared to the S&P 500 Index’s 60% return over the period. Will small cap outperformance continue in 2021? The early stages of this business cycle may help determine the direction for small caps as well as earnings per share, stock valuations, and technical trends.
Favorable Part of the Cycle
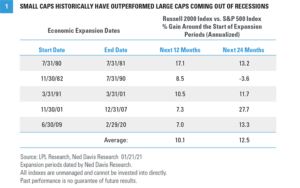
Small cap stocks historically have performed well early in economic cycles. Given that the US economy likely came out of recession late last summer or early fall of 2020, 2021 certainly qualifies as early in this cycle. The tremendous performance by small cap stocks over the past 10 months suggests that a lasting economic expansion has begun in earnest and seems to validate the historical cycle pattern of small caps beating large caps early in cycles. [FIGURE 1] illustrates how the Russell 2000 Index historically has performed relative to the large cap S&P 500 Index during the early stages of prior economic expansions. Almost every time coming out of recession, small caps outperformed large caps over the subsequent 12 and 24 months; they outperformed by an average of 10.1% over the first year and 12.5% over the subsequent two years (on an annualized basis). We think this historical trend bodes well for small caps in 2021, though we acknowledge some excess returns probably have been pulled forward and already achieved with the recent stellar small cap run.
Strong Earnings Rebound
During recessions like the US economy suffered in 2020, smaller companies that generally tend to have weaker balance sheets and more economically sensitive revenue usually are hit harder than their large cap counterparts. That definitely played out in 2020, with FactSet’s consensus estimates calling for a substantial 51% decline in small cap earnings, based on the Russell 2000, compared with only a 15% annual decline in earnings from large cap S&P 500 companies. The reverse tends to occur coming out of recessions, as small cap earnings typically grow much faster during the initial economic recovery phase. The numbers tell that story too, as small cap earnings in 2021 are expected to surge more than 150%, compared with a still respectable 23% for S&P 500 earnings, which pales in comparison. Remarkably, consensus earnings estimates for 2021 of $166.25 per share for the Russell 2000 are 23% above pre-pandemic 2019 levels. For the S&P 500, 2021 estimates are currently only 4% above 2019 levels. Small cap earnings also enjoy more momentum right now, with estimates having risen sharply since the start of the fourth quarter of 2020. Russell 2000 earnings estimates for 2021 have been raised by 12% since October 1, 2020, compared to just 2% for the S&P 500. Expectations of this sharp earnings rebound have helped drive strong small cap performance since the bull market began in March 2020. Small cap stocks are broadly more economically sensitive than large cap stocks, which is helpful when economic growth expectations improve. This helps explain why optimism surrounding the reopening of the economy and prospects for more fiscal stimulus under the new administration have given small caps such a big boost lately. We think a higher US corporate tax rate—which we expect in 2022—is a key risk to earnings next year and would likely hurt small cap earnings more than their large cap counterparts because small cap companies tend to be more domestically focused. All earnings data and consensus estimates are sourced from FactSet.
Pricing in Good News
Small cap stocks are trading at a substantial premium valuation to large caps—about 40% based on next 12 months’ price-to-earnings multiples. When looking out to 2022—when earnings will be closer to their full potential—valuations don’t look quite as rich, with the small cap PE about 27% above that of large caps. The strong small cap earnings growth outlook probably deserves a premium valuation at this point. Over the past 10 years, small caps have traded at a 37% higher forward PE than large caps. However, with the Russell 2000 having more than doubled since the March 2020 lows, we think it makes sense to be a bit cautious with small cap stocks in the near term. They are pricing in an optimistic recovery scenario when the ongoing threat of COVID-19 could delay the full reopening of the US economy a little longer. Also consider that a weaker US dollar—which we expect in 2021—tends to help large cap multinationals more than smaller companies due to their higher international revenue exposure, which may limit the ability of small caps stocks to outperform.
Post-Election Surge
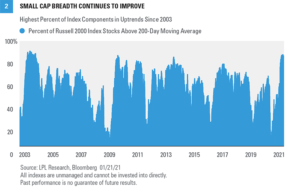
With much of the focus in 2020 on the performance of large cap growth and the “stay at home” trade, some investors may have overlooked the fact that the Russell 2000 actually outperformed the S&P 500 for the year, albeit slightly. Small caps were down year-to-date heading into the presidential election in November, but the policy clarity and prospects for more fiscal stimulus sparked a year-end rally of more than 22%, and pushed the Russell 2000 to its first all-time high since August 2018 [FIGURE 2]. Performance has not be limited to the index level, either. Breadth continues to improve for small caps. (Breadth is the percentage of stocks in the category participating in the market.) The percent of index constituents trading above their 200-day moving average has surged to over 89%, the highest level since 2004. Not only is strong breadth a hallmark of a healthy market, but the levels of participation we are seeing now tend to be found almost exclusively at the beginning of bull markets, not the end. The election outcome, stimulus prospects, and progress toward fully reopening the economy as COVID-19 vaccines are distributed have triggered a leadership change from large caps to small caps. However, it has not triggered the sort of style rotation we have seen within the large cap space. Even as large cap value has outperformed large cap growth by more than 5 percentage points over the past three months, small cap growth and small cap value performance have been equally stellar, with both the Russell 2000 Growth and Russell 2000 Value indexes returning 34%.
LPL Research's View
At this point we are comfortable maintaining our neutral small cap view—but with a positive bias. We are in a favorable part of the economic cycle, the earnings outlook is quite strong, and small caps are enjoying strong breadth within the universe with most stocks exhibiting positive momentum. But much of the good news may be priced in already, introducing the potential for disappointment if COVID-19 delays the full reopening of the economy. Also, currency and tax headwinds may be on the horizon. Thank you to LPL Research Senior Analyst Scott Brown, CMT for contributing to this commentary. Read previous editions of Weekly Market Commentary on lpl.com at News & Media. Jeffrey Buchbinder, CFA, Equity Strategist, LPL Financial
Ryan Detrick, CMT, Chief Market Strategist, LPL Financial
Nick Pergakis, Analyst, LPL Financial ______________________________________________________________________________________________ IMPORTANT DISCLOSURES This material is for general information only and is not intended to provide specific advice or recommendations for any individual. There is no assurance that the views or strategies discussed are suitable for all investors or will yield positive outcomes. Investing involves risks including possible loss of principal. Any economic forecasts set forth may not develop as predicted and are subject to change. References to markets, asset classes, and sectors are generally regarding the corresponding market index. Indexes are unmanaged statistical composites and cannot be invested into directly. Index performance is not indicative of the performance of any investment and do not reflect fees, expenses, or sales charges. All performance referenced is historical and is no guarantee of future results. Any company names noted herein are for educational purposes only and not an indication of trading intent or a solicitation of their products or services. LPL Financial doesn’t provide research on individual equities. All information is believed to be from reliable sources; however, LPL Financial makes no representation as to its completeness or accuracy. US Treasuries may be considered “safe haven” investments but do carry some degree of risk including interest rate, credit, and market risk. Bonds are subject to market and interest rate risk if sold prior to maturity. Bond values will decline as interest rates rise and bonds are subject to availability and change in price. The Standard & Poor’s 500 Index (S&P500) is a capitalization-weighted index of 500 stocks designed to measure performance of the broad domestic economy through changes in the aggregate market value of 500 stocks representing all major industries. The PE ratio (price-to-earnings ratio) is a measure of the price paid for a share relative to the annual net income or profit earned by the firm per share. It is a financial ratio used for valuation: a higher PE ratio means that investors are paying more for each unit of net income, so the stock is more expensive compared to one with lower PE ratio. Earnings per share (EPS) is the portion of a company’s profit allocated to each outstanding share of common stock. EPS serves as an indicator of a company’s profitability. Earnings per share is generally considered to be the single most important variable in determining a share’s price. It is also a major component used to calculate the price-to-earnings valuation ratio. All index data from FactSet. Please read the full Outlook 2021: Powering Forward publication for additional description and disclosure. This research material has been prepared by LPL Financial LLC. Securities and advisory services offered through LPL Financial (LPL), a registered investment advisor and broker-dealer (member FINRA/SIPC). Insurance products are offered through LPL or its licensed affiliates. To the extent you are receiving investment advice from a separately registered independent investment advisor that is not an LPL affiliate, please note LPL makes no representation with respect to such entity. Not Insured by FDIC/NCUA or Any Other Government Agency | Not Bank/Credit Union Guaranteed | Not Bank/Credit Union Deposits or Obligations | May Lose Value
RES-58550-0121 | For Public Use | Tracking # 1-05102970 (Exp. 01/22)
The resilience of the US economy continues to exceed our expectations. With encouraging progress toward ending the pandemic, and massive fiscal stimulus in place—and more likely coming soon, our prior economic growth forecasts may prove overly conservative. In addition, we believe a strong fourth quarter earnings season supports an increase in our earnings forecasts for 2021 and, in turn, our fair value S&P 500 target.
Economic Growth Poised to Accelerate in 2021
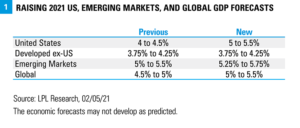
We are upgrading our 2021 forecasts for US gross domestic product (GDP) growth from 4–4.5% to 5–5.5% [FIGURE 1]. When we first issued our GDP forecast for 2021 in Outlook 2021: Powering Forward back in December of 2020, we did not expect additional fiscal stimulus to pass until this year (it came in the form of a roughly $900 billion package passed on December 29), nor did we anticipate another $1 trillion or more to come this spring, which is now very likely given the Democrats have control of Congress. Our ETA for another package at this point is late March, with the Democrats pursuing reconciliation requiring just 51 votes in the Senate (including Vice President Kamala Harris and 50 Democratic Senators). Stimulus is the primary reason for the increase in our economic growth forecasts, though we are encouraged by the progress made toward ending the pandemic in recent weeks. The holiday surge in COVID-19 cases has largely passed, and new daily COVID-19 cases in the United States have fallen roughly 60% from the January 8 peak. Meanwhile, the total number of patients currently hospitalized with COVID-19 has fallen below 100,000 for the first time since early December. The vaccine rollout in the US has picked up speed—we are now averaging more than 1.3 million doses per day, according to the Centers for Disease Control and Prevention (CDC)—and additional vaccine candidates are likely coming soon that can help boost supply—in particular the Johnson & Johnson vaccine that is easier to transport and store. Prospects for better US growth should flow through to export-driven emerging market (EM) economies, so we have slightly increased our EM GDP growth outlook as well, in addition to our global GDP forecast.
Raising Our S&P 500 Index Fair Value Target on Stronger Earnings
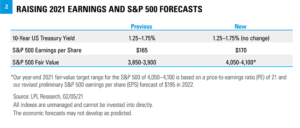
The lockdowns and resulting deep recession from the pandemic led analysts to aggressively reduce earnings estimates last spring. Though not clear at the time, in hindsight those cuts have proved far too draconian. Earnings estimates for 2020 and 2021 bottomed in July and have been climbing steadily ever since, suggesting S&P 500 companies may recapture their 2019 pre-pandemic earnings power before the end of this year—a truly remarkable achievement considering the challenges. A surprisingly strong fourth quarter earnings season increases our confidence in the outlook for corporate America. With about 60% of S&P 500 companies having reported, fourth quarter earnings for the index are on pace to grow about 2% year over year, according to FactSet—standing in stark contrast from the 13% decline reflected in analysts’ consensus estimate when the fourth quarter began on October 1, 2020. During just three full weeks of earnings reports, consensus S&P 500 earnings estimates for 2021 have increased by 3.6%, a period during which estimates typically fall 2-3%. In light of the better US economic growth prospects and impressive performance by corporate America during the most recent quarter, we are raising our 2021 and 2022 S&P 500 earnings forecasts from $165 and $190 per share to $170 and $195 per share. Higher corporate tax rates in 2022 present some risk to that forecast. A stronger earnings outlook supports higher stock prices, in our view, so we are also raising our year-end 2021 fair value target range for the S&P 500 from 3850–3,900 to 4,050–4,100 (4–6% above the February 5 close). The new target range is based on a price-to-earnings ratio of just below 21 times our 2022 earnings per share forecast of $195 [FIGURE 2].
Positioning Implications
As the economy fully opens and economic growth potentially accelerates more than we had previously anticipated, we believe the macroeconomic environment for value stocks may continue to improve. Growth stocks have had a tremendous run over the past decade—accentuated by the “stay-at-home / work-from-home” environment during the pandemic that gave many growth-style stocks an earnings boost. But over the past several months as vaccines have been approved (with more likely on the way), more stimulus arrived (also more potentially on the way) and investors gained more confidence in the reopening, value stocks have performed better. As a result, we are squaring up our views of growth and value. Strong growth-style fundamentals and our positive view of the technology sector keep us from a negative view of growth. A stronger and fully open economy is also supportive of small cap stocks. We upgraded our view of small caps to neutral in September 2020 and continue to have a positive bias. The earnings recovery in smaller companies since last summer has been even more impressive than that of their larger counterparts. From a sector perspective, stronger growth may bring more demand for energy globally. In addition, recent comments from OPEC + Russia suggest production increases may be quite gradual and could help provide support for oil prices which have already made a big move, gaining $20 in just the past 3 months to near $57 per barrel for WTI crude.
Conclusion
Our confidence in a full economic recovery is growing. A fully reopened economy is closer to becoming a reality on a combination of falling COVID-19 cases and hospitalizations, better treatments, more than a million shots going in people’s arms each day, and the resilience of the US consumer and businesses—both large and small—to power through the immense challenges the pandemic has presented. Plus massive fiscal stimulus likely to exceed 20% of US GDP and a Federal Reserve that is expected to remain supportive for the foreseeable future further solidify the bull case. But the battle against COVID-19 isn’t over unfortunately. New, more infectious variants of COVID-19 are out there. The vaccine rollout will take time, and there will be holdouts. Consumer behavior may be slower to return to normal than we might expect. We see these risks as manageable at this point and believe the market will continue to look forward to life on the other side of the pandemic. Read previous editions of Weekly Market Commentary on lpl.com at News & Media. Jeffrey Buchbinder, CFA, Equity Strategist, LPL Financial
Ryan Detrick, CMT, Chief Market Strategist, LPL Financial
Nick Pergakis, Analyst, LPL Financial ______________________________________________________________________________________________ IMPORTANT DISCLOSURES This material is for general information only and is not intended to provide specific advice or recommendations for any individual. There is no assurance that the views or strategies discussed are suitable for all investors or will yield positive outcomes. Investing involves risks including possible loss of principal. Any economic forecasts set forth may not develop as predicted and are subject to change. References to markets, asset classes, and sectors are generally regarding the corresponding market index. Indexes are unmanaged statistical composites and cannot be invested into directly. Index performance is not indicative of the performance of any investment and do not reflect fees, expenses, or sales charges. All performance referenced is historical and is no guarantee of future results. Any company names noted herein are for educational purposes only and not an indication of trading intent or a solicitation of their products or services. LPL Financial doesn’t provide research on individual equities. All information is believed to be from reliable sources; however, LPL Financial makes no representation as to its completeness or accuracy. US Treasuries may be considered “safe haven” investments but do carry some degree of risk including interest rate, credit, and market risk. Bonds are subject to market and interest rate risk if sold prior to maturity. Bond values will decline as interest rates rise and bonds are subject to availability and change in price. The Standard & Poor’s 500 Index (S&P500) is a capitalization-weighted index of 500 stocks designed to measure performance of the broad domestic economy through changes in the aggregate market value of 500 stocks representing all major industries. The PE ratio (price-to-earnings ratio) is a measure of the price paid for a share relative to the annual net income or profit earned by the firm per share. It is a financial ratio used for valuation: a higher PE ratio means that investors are paying more for each unit of net income, so the stock is more expensive compared to one with lower PE ratio. Earnings per share (EPS) is the portion of a company’s profit allocated to each outstanding share of common stock. EPS serves as an indicator of a company’s profitability. Earnings per share is generally considered to be the single most important variable in determining a share’s price. It is also a major component used to calculate the price-to-earnings valuation ratio. All index data from FactSet. Please read the full Outlook 2021: Powering Forward publication for additional description and disclosure. This research material has been prepared by LPL Financial LLC. Securities and advisory services offered through LPL Financial (LPL), a registered investment advisor and broker-dealer (member FINRA/SIPC). Insurance products are offered through LPL or its licensed affiliates. To the extent you are receiving investment advice from a separately registered independent investment advisor that is not an LPL affiliate, please note LPL makes no representation with respect to such entity. Not Insured by FDIC/NCUA or Any Other Government Agency | Not Bank/Credit Union Guaranteed | Not Bank/Credit Union Deposits or Obligations | May Lose Value
RES-658604-0221 | For Public Use | Tracking # 1-05108722 (Exp. 02/22)
As a result of the Senate runoffs in Georgia, Democrats are poised to take control of the US Senate, which would give them a majority in both houses of Congress. This will shift the policy outlook moderately to the left, but majorities are still razor-thin, giving moderates heavy influence. We also envision a potential move toward increased bipartisanship, which may help bring more clarity to policy in 2021.
Georgia on Our Mind
Assuming the Georgia Senate races play out in line with the current vote count, Democrats will soon have control of both chambers of Congress as well as the presidency, at least until mid-term elections in 2022. While there is a material difference between the Senate flipping to Democratic control and Republicans holding the Senate, we don’t believe it’s a radical shift. The Democrat’s Senate majority will be razor thin, with the Senate split 50–50 and Vice President-elect Kamala Harris casting any tie-breaking vote. That means legislation will need to satisfy the most moderate Democratic Senators, such as West Virginia’s Joe Manchin and Montana’s Jon Tester. If Democrats lose votes from the left wing of their party, they will need to pull in moderate Republicans as well. With such a narrow margin, eliminating the filibuster is basically off the table. On many key legislative issues, Senate Democrats will need to muster 60 votes. The Democratic majority in the US House also narrowed significantly in the 2020 election and currently stands at 222–211 with two vacancies, creating a similar challenge.
Little Things Matter in Policy
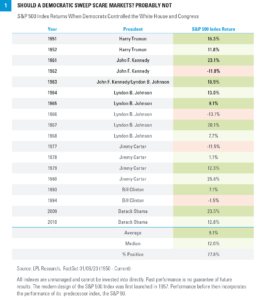
Historically, which party occupied the White House or controlled Congress hasn’t had a meaningful impact on broad stock market performance. Policy matters—but larger economic forces are much more influential, and businesses are very good at adapting to different political environments. Having an environment where it’s easier to start or run a business can make a big difference in people’s lives, but the policy impact on markets tends to be more focused. Markets historically have seemed to prefer divided government, whether because it removes the extremes or it encourages a spirit of compromise. At the same time, market performance when Democrats have held the presidency and controlled both the House and the Senate has been in line with longer-term historical returns [Figure 1]. The distribution of power in Washington, DC, by itself does not mean a lot, especially since voters have the chance to change the balance of power every two years.
Taxes, Regulation, and Stimulus in Focus
The most important shift in policy expectations following the Georgia runoffs are around taxes, regulation, and stimulus prospects. Taxes. Business taxes will almost certainly increase due to the new makeup of Congress. The Tax Cut and Jobs Act of 2017 (TCJA) lowered the top corporate tax rate from 35% to 21%. The top tax rate is likely to be raised to 25–27%, although the timing may be delayed depending on the economic recovery. When an increase is imposed, the hit to corporate profits potentially could be around 5%. Tax rates for the wealthy also are likely to increase and would likely take place under the obscure reconciliation process, which is how the TCJA was passed. The reconciliation process requires only a 50% majority, but the bill must be deficit neutral over a 10-year window to qualify. Regulation. A Democratic majority in the Senate will also have regulatory implications. First, it would make it easier for President-elect Joe Biden to confirm cabinet members more tilted toward the left wing of the party. The majority party in the Senate also has considerable power to review regulation. Environmental regulations and labor standards probably will be a focus, likely reversing many Trump administration deregulatory efforts. Stimulus. Democratic control of the Senate also will make it easier to pass additional stimulus measures, although, again, a slim majority may limit the scope. The most recent stimulus package, passed at the end of 2020, was for $900 billion. Democrats may try to pass an additional package of approximately $1 trillion or more. Passing some kind of infrastructure bill where there are some areas of bipartisan support also may become more likely. Markets are likely to applaud potential economic benefits of additional stimulus in the near term, but it also will push deficits higher and may weigh on the economy over the longer run. The overall impact of the “before” and “after” of the Georgia elections likely will be a mixed market at best, one that probably will be small compared to more important market drivers, such as the effectiveness of COVID-19 vaccine rollout efforts and Federal Reserve policy. Higher taxes likely are the most market-negative takeaway of the Georgia runoffs, but there may be some economic offset from improved fiscal stimulus prospects, which could spur economic growth and support overall sales growth.
Investment Impacts
Growth and value equities. Improved stimulus prospects may encourage rotation toward areas of the market that may respond positively to economic reopening. This possibly could accelerate the timetable for taking a more balanced approach to the growth and value equity styles and extend the run for smaller cap stocks, although prospects of higher taxes may eventually be a headwind for small caps. Muni bonds. If tax increases are passed, municipal bonds may also become more attractive. Higher taxes may support demand while stimulus provisions that provide aid to state and local governments can help shore up municipalities’ financials. It is likely that municipal bonds have already begun to price in this favorable environment, as municipal yields relative to Treasuries have declined more than 35% since Election Day. While this may suggest that valuations are less attractive, we would consider any cheapening to be an opportunity, particularly for high-yielding municipals. Sector investing. Democratic control of Congress may pave the way for more thematic sector investing. We have discussed the strong run that clean-energy-themed sectors had enjoyed leading up to the election. Control of Congress could further open the door for the Biden administration to pursue green energy policies. Meanwhile, we have remained positive on the healthcare sector, and the expansion of the Affordable Care Act (ACA) may be positive for managed care stocks and the broader healthcare sector. US dollar. The anticipated impact of higher deficits due to added fiscal stimulus could continue to put pressure on the US dollar despite already meaningful declines. Dollar weakness would support international stocks in dollar terms. Potential easing of trade tensions under the Biden administration and higher corporate taxes also would likely be dollar negative. US Treasury yields. Our 10-year Treasury yield forecast of 1.25–1.75% for year-end 2021 remains in place. However, we have been expressing a bias toward the lower end of the range. The economic boost from fiscal stimulus shifts the bias to neutral.
LPL Research's Market Views for 2021
We are only a week into 2021, and so far it has felt much like 2020 with an unexpected political environment. The Georgia Senate races delivered markets a surprise, and the events of January 6 were both shocking and saddening, independent of policy or party. The election outcomes have led us to adjust some of the 2021 market views we initially offered in Outlook 2021: Powering Forward, released in December 2020, but we have not made any major changes. Politics will look different than expected in December, and the policy outlook has changed. But the most important market driver likely will be the global response to COVID-19 and the momentum of the still young economic recovery. Read previous editions of Weekly Market Commentary on lpl.com at News & Media. Barry Gilbert, PhD, CFA, Asset Allocation Strategist, LPL Financial
Nick Pergakis, Analyst, LPL Financial IMPORTANT DISCLOSURES This material is for general information only and is not intended to provide specific advice or recommendations for any individual. There is no assurance that the views or strategies discussed are suitable for all investors or will yield positive outcomes. Investing involves risks including possible loss of principal. Any economic forecasts set forth may not develop as predicted and are subject to change. References to markets, asset classes, and sectors are generally regarding the corresponding market index. Indexes are unmanaged statistical composites and cannot be invested into directly. Index performance is not indicative of the performance of any investment and do not reflect fees, expenses, or sales charges. All performance referenced is historical and is no guarantee of future results. Any company names noted herein are for educational purposes only and not an indication of trading intent or a solicitation of their products or services. LPL Financial doesn’t provide research on individual equities. All information is believed to be from reliable sources; however, LPL Financial makes no representation as to its completeness or accuracy. US Treasuries may be considered “safe haven” investments but do carry some degree of risk including interest rate, credit, and market risk. Bonds are subject to market and interest rate risk if sold prior to maturity. Bond values will decline as interest rates rise and bonds are subject to availability and change in price. The Standard & Poor’s 500 Index (S&P500) is a capitalization-weighted index of 500 stocks designed to measure performance of the broad domestic economy through changes in the aggregate market value of 500 stocks representing all major industries. The PE ratio (price-to-earnings ratio) is a measure of the price paid for a share relative to the annual net income or profit earned by the firm per share. It is a financial ratio used for valuation: a higher PE ratio means that investors are paying more for each unit of net income, so the stock is more expensive compared to one with lower PE ratio. Earnings per share (EPS) is the portion of a company’s profit allocated to each outstanding share of common stock. EPS serves as an indicator of a company’s profitability. Earnings per share is generally considered to be the single most important variable in determining a share’s price. It is also a major component used to calculate the price-to-earnings valuation ratio. All index data from FactSet. Please read the full Outlook 2021: Powering Forward publication for additional description and disclosure. This research material has been prepared by LPL Financial LLC. Securities and advisory services offered through LPL Financial (LPL), a registered investment advisor and broker-dealer (member FINRA/SIPC). Insurance products are offered through LPL or its licensed affiliates. To the extent you are receiving investment advice from a separately registered independent investment advisor that is not an LPL affiliate, please note LPL makes no representation with respect to such entity.
Not Insured by FDIC/NCUA or Any Other Government Agency | Not Bank/Credit Union Guaranteed | Not Bank/Credit Union Deposits or Obligations | May Lose Value
RES-50200-0121 | For Public Use | Tracking # 1-05097521 (Exp. 01/22)
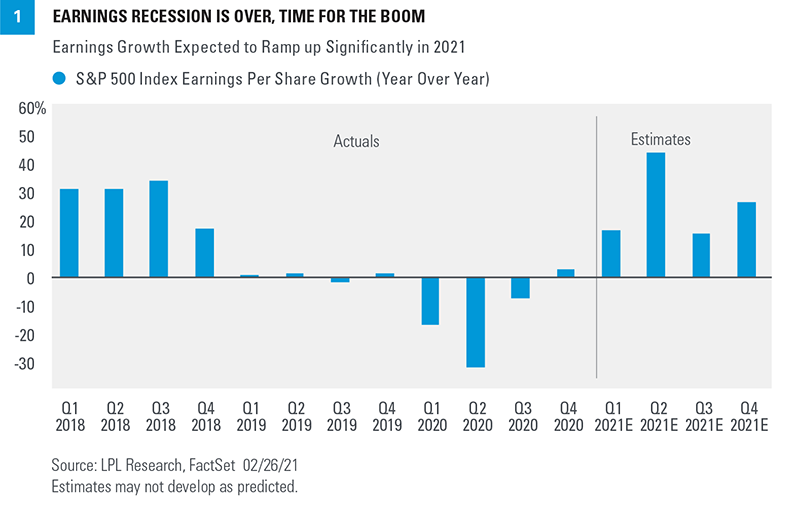
Fourth-quarter earnings season is in the home stretch, and it’s been a good one. After raising our 2021 earnings forecast for the S&P 500 Index in our Weekly Market Commentary on February 8, our upgraded forecast may now be too low, based on what we have learned from corporate America during the three weeks since. In this commentary, we recap earnings season and share our latest thoughts on just how strong the earnings rebound could be in 2021 and beyond.
Outstanding Numbers in the Fourth Quarter
Coming into fourth-quarter earnings season, investors had plenty of reasons to expect that companies would deliver better-than-expected results. The US economy grew at a solid 4% annualized pace in the fourth quarter (source: Bureau of Economic Analysis GDP data). Strong manufacturing surveys signaled better earnings ahead. Analysts’ earnings estimates rose during the quarter, as companies issuing fourth-quarter guidance mostly raised expectations. Now that all the numbers are pretty much in the books (93% of S&P 500 companies have reported results), it’s clear that optimism was warranted as earnings impressively grew during the quarter [Figure 1]. In our earnings preview on January 19, 2021, we wrote: Consider that the bar has been raised substantially over the past two quarters, making it tougher to clear. That probably takes positive earnings growth off the table, but a low-to-mid single-digit decline in earnings would be a positive outcome, especially if forward estimates hold up as fresh guidance is provided. After the bar had been raised, with the prior two quarters following similarly strong results compared to expectations, it made a lot of sense to expect more limited upside as estimates catch up to reality. But it turned out another quarter of huge upside—and earnings growth—was in the cards as corporate America again blew by expectations. S&P 500 companies delivered more earnings during the still-pandemic plagued Q4 2020 than in (pre-pandemic) Q4 2019. Here are the impressive numbers:
Fourth-quarter earnings growth for the S&P 500 is tracking to 3.5%, more than 12 percentage points above the consensus estimate at quarter-end (December 31, 2020).
A near-record 79% of S&P 500 companies have exceeded earnings estimates, above the five-year average of 74%.
Five sectors grew their earnings by double-digits: communication services, financials, healthcare, materials, and information technology.
Sales for S&P 500 companies in aggregate impressively rose more than 3% year over year.
During earnings season, the consensus earnings estimate for the next 12 months rose 4%, compared with the average 2-3% reduction historically.
All earnings data is sourced from FactSet These results were particularly impressive given the wave of COVID-19 that brought some new targeted restrictions late last year.
Bar Raised Again
So, not only did corporate America deliver big upside to estimates—but their outlooks for 2021 were positive enough to drive a sizable increase in estimates. As shown in Figure 2, since the start of fourth quarter 2020 on October 1, 2020, estimates for 2020 and 2021 have increased significantly. These increases in estimates may be a sign of better earnings ahead. The economic recovery has continued to surpass expectations, based on solidly positive economic surprise indexes and our own expectations. More stimulus—a lot more—is likely coming soon, which could drive US GDP growth above our forecast of 5—5.5%. All of this suggests that our estimate for S&P 500 earnings this year of $170 per share could end up being conservative (analysts’ consensus estimate is up to $174). We see two risks to 2021 earnings. First, earnings tend to fall short of the consensus estimate in most years, though this year may be different given the unique circumstances. Second, COVID-19 still carries risks. We’d like to see further progress toward ending the pandemic first, but we see upside if all goes according to plan. Our 2022 forecast for S&P 500 earnings of $195 per share (raised from $190 on February 8) may be tougher to achieve because it does not include higher corporate taxes—which we see as likely next year (the consensus estimate stands at $200 per share). With stock valuations elevated, and corporate America not firing on all cylinders for a good chunk of 2021, earnings in 2022 take on greater importance. We expect stocks to deliver these strong earnings over the next 22 months and grow into their valuations, but it won’t be easy. Profits could potentially get a boost if wage increases are contained as the labor market tightens. Help could also come from a weaker US dollar (which boosts non-US profits through currency translation), stronger-than-expected international demand, and a possible reduction in tariffs.
Reiterating Positive Stock Market Outlook
Our confidence in the economic recovery continues to grow, bolstered by vaccine distribution, and fiscal and monetary stimulus. We anticipate a strong earnings rebound will enable stocks to grow into their elevated valuations, even if interest rates move a bit higher from here. Markets may still be underestimating the potential for pent-up demand to drive a sharp rebound in activity during the spring and summer as the economy fully reopens. COVID-19 still presents lingering near-term risk. Additional sharp and swift moves higher in interest rates could potentially cause valuations to contract meaningfully, though we see that as unlikely. So while a pickup in volatility would be normal at this stage of a strong bull market, we think suitable investors may want to consider buying this dip. We continue to recommend an overweight to equities and underweight to fixed income relative to investors’ targets, as appropriate. We reiterate our S&P 500 Index fair value target range of 4,050–4,100 at year-end 2021, based on a price-to-earnings (PE) multiple near 21 and our 2022 earnings forecast of $195. Read previous editions of Weekly Market Commentary on lpl.com at News & Media. Jeffrey Buchbinder, CFA, Equity Strategist, LPL Financial
Ryan Detrick, CMT, Chief Market Strategist, LPL Financial ______________________________________________________________________________________________ IMPORTANT DISCLOSURES This material is for general information only and is not intended to provide specific advice or recommendations for any individual. There is no assurance that the views or strategies discussed are suitable for all investors or will yield positive outcomes. Investing involves risks including possible loss of principal. Any economic forecasts set forth may not develop as predicted and are subject to change. References to markets, asset classes, and sectors are generally regarding the corresponding market index. Indexes are unmanaged statistical composites and cannot be invested into directly. Index performance is not indicative of the performance of any investment and do not reflect fees, expenses, or sales charges. All performance referenced is historical and is no guarantee of future results. Any company names noted herein are for educational purposes only and not an indication of trading intent or a solicitation of their products or services. LPL Financial doesn’t provide research on individual equities. All information is believed to be from reliable sources; however, LPL Financial makes no representation as to its completeness or accuracy. US Treasuries may be considered “safe haven” investments but do carry some degree of risk including interest rate, credit, and market risk. Bonds are subject to market and interest rate risk if sold prior to maturity. Bond values will decline as interest rates rise and bonds are subject to availability and change in price. The Standard & Poor’s 500 Index (S&P500) is a capitalization-weighted index of 500 stocks designed to measure performance of the broad domestic economy through changes in the aggregate market value of 500 stocks representing all major industries. The PE ratio (price-to-earnings ratio) is a measure of the price paid for a share relative to the annual net income or profit earned by the firm per share. It is a financial ratio used for valuation: a higher PE ratio means that investors are paying more for each unit of net income, so the stock is more expensive compared to one with lower PE ratio. Earnings per share (EPS) is the portion of a company’s profit allocated to each outstanding share of common stock. EPS serves as an indicator of a company’s profitability. Earnings per share is generally considered to be the single most important variable in determining a share’s price. It is also a major component used to calculate the price-to-earnings valuation ratio. All index data from FactSet. Please read the full Outlook 2021: Powering Forward publication for additional description and disclosure. This research material has been prepared by LPL Financial LLC. Securities and advisory services offered through LPL Financial (LPL), a registered investment advisor and broker-dealer (member FINRA/SIPC). Insurance products are offered through LPL or its licensed affiliates. To the extent you are receiving investment advice from a separately registered independent investment advisor that is not an LPL affiliate, please note LPL makes no representation with respect to such entity. Not Insured by FDIC/NCUA or Any Other Government Agency | Not Bank/Credit Union Guaranteed | Not Bank/Credit Union Deposits or Obligations | May Lose Value
RES-670100-0221 | For Public Use | Tracking # 1-05116224 (Exp. 03/22)
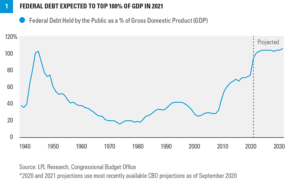
The level of US debt, already elevated before COVID-19 hit, skyrocketed as Congress put into place much needed fiscal stimulus in response to the pandemic, and it may jump again as the Biden administration targets its stimulus goals. Markets have seemed unfazed by fiscal stimulus measures, and they’ll likely stay that way at least through 2021, but there will likely be economic consequences in the long term.
Debt Levels Soaring
US Federal government debt is likely to pass 100% of gross domestic product (GDP) in 2021, a level only seen during the massive World War II war effort [Figure 1]. Markets have seemed largely unfazed by skyrocketing government debt levels. To the contrary, they have seemed to embrace the improved economic outlook that comes with stimulus. At the same time, concern over debt levels have become more widespread. While some pundits have been dismissive of growing debt concerns, we think the reasons for increased scrutiny are clear and grounded in common sense. You don’t get something for nothing, so at some point rising debt levels will have consequences. There are also concerns about the moral hazard that can come with unchecked spending. Increasing debt levels may be justified, but we should at least be wary enough about it to have a sense of a reasonable point for restraint. Finally, many view the debt not as the government’s but the people’s, and we naturally want our representatives to be careful with our dollars. Why have markets seemed indifferent to the rising national debt and when, and how, will it end? The answer to the first question is that we’re still well positioned right now for additional spending to have a reasonable positive impact on the economy with fewer of the usual risks. As to when the market indifference will end, at the very least, probably not in 2021 or even 2022. But eventually debt will likely weigh on growth, whether through periods of relative austerity or from economic consequences, but the impact can be spread out over time, especially if the political will comes around quickly enough.
All Debt is Not Created Equal
Rising debt levels, whether through increased spending, reduced revenue (lower taxes), or both, is not always bad. It is at its worst when policymakers are simply reaping the political rewards of enabling people to spend more than they otherwise would at the cost of future spending. The impact is also worse the higher the cost of borrowing, whether directly, through high interest rates, or indirectly, through indirect economic consequences. But government debt is not always bad. Not all debt is created equal. When can borrowing make sense? There are two main cases:
Investment – If debt-financed investment leads to increased future economic growth, the debt can pay for itself. Similarly, if tax cuts, which also raise the debt in the near term, stimulates investment, the increased debt can also pay for itself. Sometimes the investment is simply maintenance, where the negative impact of not spending is worse than the cost of borrowing. Be careful, though. While investment can pay for the cost of debt, both Democrats and Republicans will always claim that the benefits of their debt-financed programs will outweigh the costs. Historically, both sides have often been mistaken.
Stimulating demand – There are also times, especially during or immediately after a recession, when demand is lower than it otherwise could be, often due to a combination of uncertainty about the future leading to more cautious behavior and weaker labor markets. During these periods, stimulating demand can often have a multiplier effect, adding more to economic growth than the dollar amount spent.
So far, most of the added fiscal stimulus during the COVID-19 pandemic has likely been less costly than doing nothing. That will probably be true for at least some of any additional stimulus that might be passed, which is why markets so far appear to be responding positively to the prospect of additional government spending. We don’t have particular guidance on the right size for the next stimulus package(s), but up to some point it will be cheaper than doing nothing at all.
Now is A Good Time to Borrow
High national debt levels and heavy borrowing can weigh on an economy in a number of ways. Future interest payments are a drain on tax revenues. The government is competing with businesses for investment dollars, making it harder for them to have access to capital. Adding to demand when it’s not needed can increase inflation. Excess stimulus can also weaken a currency. We are actually in an economic environment that, at least for now, mitigates these risks. It doesn’t mean that governments should borrow just because they can. But it does mean if they need to, it’s a good time to do it.
Interest rates are low –While debt levels are high, interest payments as a percent of GDP are about half the level they were at in the ‘90s. If you are going to borrow, borrow when rates are low.
Savings levels are high – Saving levels in the United States have risen dramatically during the pandemic, due to a combination of fewer opportunities to spend, increased caution, and fiscal stimulus helping to replace some lost income. The problem of the government competing for investment dollars with businesses has a lower impact when there is ample savings.
Structural forces are still helping to contain inflation – While stimulus will contribute to some inflation as the economy opens up, excess industrial capacity and slack in the labor market may persist for some time. Also, other forces, such as demographics and technological improvements, continue to help cap inflationary pressures.
The dollar is still the global reserve currency – The US has a structural advantage as a borrower—the US dollar remains the dominant reserve currency. Many global transactions take place in dollars, establishing demand for the greenback, which creates demand in turn for Treasuries
But it it Sustainable?
Near-term anticipated national debt levels are sustainable in that we don’t think they’ll lead to a sudden financial crisis, but that doesn’t mean they’re without consequences. They are already leading, for example, to an inclination toward some austerity, in part because high debt levels come with uncertain risk. Ultimately, this may make it harder to provide stimulus where and when needed in the future. And debt levels likely have contributed to lower productivity gains as less efficient government spending becomes a larger part of the economy. The biggest challenge, though, is that the continued growth of entitlement programs due to demographic pressures will increase the debt over time and will have to be addressed eventually. Unfortunately, making a genuine effort to lower the yearly deficit, never mind the accumulated national debt, is a losing political issue and there is little political will to do it. Since 1965, the US government has run a surplus in only five fiscal years, 1969 and 1998–2001. Extended delays will make the issue harder to tackle once policymakers have little alternative. But even then the solutions will be incremental, it will just have to be a bigger step. Any solution will have to work on different levels: entitlement reform (for example, raising the age at which people can take social security or adding means testing), higher taxes in some form, and lower spending. Even then, though, the most important takeaway is that the debt will need to be addressed eventually and will likely weigh on growth, it’s unlikely to create a crisis. Japan’s debt-to-GDP ratio, to take one of the few relevant examples we have, is twice that of the United States, and while Japan does not have as robust an economy as the US, neither does it have an economy that’s in perpetual crisis.
Market Impact
The market response so far to fiscal stimulus, and the prospect of still more, has been to price in better economic growth. Those expectations have played a role in pushing up bond yields as well, although they remain extremely low. Stocks also responded positively to the stimulus measures of Presidents Reagan, G.W. Bush, Obama, and Trump even prior to the pandemic. The US is fortunate right now as a borrower. It has a good environment in which to borrow and has the opportunity to use borrowed funds productively. But there will come a time to show restraint again and get deficits back under control. We believe that the effect of a high debt level will be measurable and probably long lasting, but not obvious in our day-to-day lives and may have a negative but manageable impact on markets too. Entitlement reforms will add to the pressure, but again can be gradual. For now the main focus for markets will be on effectively reopening the economy. Read previous editions of Weekly Market Commentary on lpl.com at News & Media. Barry Gilbert, PhD, CFA, Asset Allocation Strategist, LPL Financial
Ryan Detrick, CMT, Chief Market Strategist, LPL Financial ______________________________________________________________________________________________ IMPORTANT DISCLOSURES This material is for general information only and is not intended to provide specific advice or recommendations for any individual. There is no assurance that the views or strategies discussed are suitable for all investors or will yield positive outcomes. Investing involves risks including possible loss of principal. Any economic forecasts set forth may not develop as predicted and are subject to change. References to markets, asset classes, and sectors are generally regarding the corresponding market index. Indexes are unmanaged statistical composites and cannot be invested into directly. Index performance is not indicative of the performance of any investment and do not reflect fees, expenses, or sales charges. All performance referenced is historical and is no guarantee of future results. Any company names noted herein are for educational purposes only and not an indication of trading intent or a solicitation of their products or services. LPL Financial doesn’t provide research on individual equities. All information is believed to be from reliable sources; however, LPL Financial makes no representation as to its completeness or accuracy. US Treasuries may be considered “safe haven” investments but do carry some degree of risk including interest rate, credit, and market risk. Bonds are subject to market and interest rate risk if sold prior to maturity. Bond values will decline as interest rates rise and bonds are subject to availability and change in price. The Standard & Poor’s 500 Index (S&P500) is a capitalization-weighted index of 500 stocks designed to measure performance of the broad domestic economy through changes in the aggregate market value of 500 stocks representing all major industries. The PE ratio (price-to-earnings ratio) is a measure of the price paid for a share relative to the annual net income or profit earned by the firm per share. It is a financial ratio used for valuation: a higher PE ratio means that investors are paying more for each unit of net income, so the stock is more expensive compared to one with lower PE ratio. Earnings per share (EPS) is the portion of a company’s profit allocated to each outstanding share of common stock. EPS serves as an indicator of a company’s profitability. Earnings per share is generally considered to be the single most important variable in determining a share’s price. It is also a major component used to calculate the price-to-earnings valuation ratio. All index data from FactSet. Please read the full Outlook 2021: Powering Forward publication for additional description and disclosure. This research material has been prepared by LPL Financial LLC. Securities and advisory services offered through LPL Financial (LPL), a registered investment advisor and broker-dealer (member FINRA/SIPC). Insurance products are offered through LPL or its licensed affiliates. To the extent you are receiving investment advice from a separately registered independent investment advisor that is not an LPL affiliate, please note LPL makes no representation with respect to such entity. Not Insured by FDIC/NCUA or Any Other Government Agency | Not Bank/Credit Union Guaranteed | Not Bank/Credit Union Deposits or Obligations | May Lose Value
RES-50200-0121 | For Public Use | Tracking # 1-05105631 (Exp. 02/22)
2020 was a year characterized in part by the outbreak of a global pandemic, which captivated the world and shocked the global economy and financial markets. As we turn the page to 2021, it can be helpful to reflect on the lessons learned from such a historic year. We offer 10 economic lessons we’ll remember from 2020.
A Year to Remember
To say that 2020 was a unique year would be an understatement. What began as an ordinary year quickly turned into an extraordinary one—does anyone even remember it was a leap year? Initial reports in early January noted that a novel virus was beginning to spread, but few at the time could comprehend how the situation would escalate. By March, the COVID-19 pandemic gripped the entire world. So after such a tumultuous year, what have we learned?
10 Takeaways From 2020
The world is full of surprises. When we published our Outlook 2020 in December 2019, we did not forecast a recession in the United States. Heading into 2020, the economy was growing modestly—we didn’t see the usual extremes like excessive spending or overleverage that have been the hallmarks of the end of past economic cycles. The outbreak of COVID-19 forced the economy to slam on the brakes as much of the world went into lockdown to contain the spread, ending the longest economic expansion ever—one that had lasted more than 10 years. Records are meant to be broken. As the imposition of stay-at-home orders kept the US consumer from spending, gross domestic product (GDP) declined a record 31% in the second quarter and unemployment skyrocketed to a post-WWII record 14.7%. When the US economy began to recover from the lockdowns, GDP rebounded 33% in the third quarter, also a record. This set the stage for what potentially could be the shortest recession on record—to be determined when the end of the recession is officially marked by the National Bureau of Economic Research. As we discussed in this year’s Outlook 2021: Powering Forward, we now expect US GDP growth of 4–4.5% in 2021 [FIGURE 1]. Stimulus matters. A historic recession required a historic policy response. Many speculated that the Federal Reserve (Fed) was out of ammunition, but policymakers proved doubters wrong. The Fed effectively lowered interest rates to zero, expanded its balance sheet by record amounts (15% of US GDP), and even ventured into purchasing corporate bonds—both investment grade and high yield—to restore function to markets and support corporate borrowing. Meanwhile, Congress passed record amounts of fiscal stimulus (totaling roughly 10% of US GDP in 2020), including small business lending and direct payments to households, to help lift the economy as it emerged from lockdowns. The path of returns typically isn’t a straight line. Ideally, the low-volatility/high-return environment of 2017 would have been the norm at this point of an economic cycle, but unfortunately it wasn’t. 2020 brought us the fastest bear market in history (down 20% from the highs), with the S&P 500 Index reaching that level in just 16 trading days on its way to a peak drawdown of roughly 34%. Supported by historic stimulus measures, stocks rebounded off the lows to climb back to new all-time highs in only 106 trading days. 2020 also was the only year when stocks experienced a 30% drawdown and managed to finish the year in positive territory. Markets can experience extraordinary short-term disruptions. At the height of the March volatility, we saw multiple Sundays when S&P 500 futures traded limit-down—when circuit-breaker mechanisms kicked in to prevent further losses. Then during regular trading sessions, stocks experienced trading halts triggered by large intraday losses. While the orderly operation of stock markets had returned by April, oil futures were not out of the woods. Global lockdowns caused energy demand to plummet and maxed out the capacity of supply tankers, sending the price of the April WTI crude oil contract into negative territory—implying someone literally would pay you to take delivery of their oil. Stock markets are forward looking. In late March, we upgraded our recommendation on equities to overweight. Though we admitted the timing of the recovery from the bear market was uncertain, we believed at that time that stocks would soon begin to price in the end of the pandemic, bolstered by the massive stimulus response. With the economy at a standstill, 2020 earnings forecasts plunged more than 25% (source: FactSet). Consensus earnings per share (EPS) estimates for the S&P 500 bottomed in late June, after the index had already rebounded 35% from the March 23 low. Stocks were well ahead of the economy and analysts’ earnings forecasts. Lower for longer. In 2020 the 10-year US Treasury yield plummeted to its lowest in history. We expect the 10-year Treasury yield will rise to a target range of 1.25–1.75% by year-end 2021 as the economy expands and inflation normalizes, but lower interest rates may be here to stay. The economic turmoil has prompted the Fed to lower interest rates and convey the intention to keep them low for an extended period of time. Few on Wall Street expect the Fed to raise interest rates before 2023, and only one member of the Fed expects a rate hike before then, according to the most recent dot-plot survey of Fed members’ policy rate projections. Stocks like election clarity. We have stressed the importance of not trying to time investment decisions based on political preferences, as we believe that stocks mainly want clarity from elections. Stocks put together another strong rally when more clarity arrived after the 2020 presidential election. They also benefited from the anticipation of a Congress likely split between Democrats and Republicans, an environment where stocks historically have delivered their strongest returns since 1950. The wonders of modern medicine. TheFood and Drug Administration so far has granted emergency use authorization to two COVID-19 vaccines, and the first doses have been administered. While there is considerable uncertainty about the mass production and distribution of the vaccines, it is a remarkable feat of modern scientific medicine nonetheless. As the vaccine is distributed, we expect the hard-hit areas of the economy—particularly service industries—will begin to improve as life slowly begins to normalize. The power of human perseverance. Many sacrifices have been made in 2020, from holding off on visiting loved ones to helping children with virtual education, and the fight against COVID-19 is not quite over despite the discovery of new vaccines. Humanity has an incredible ability to find solutions to its problems, and 2020 showed our ability to persevere as a society.
LPL Research's Outlook for 2021
The beauty of investing is there is always something to learn, and only time can provide experience—although 2020 certainly was enough experience for a lifetime. We are hoping 2021 provides another strong year of returns like 2020, though we also hope the path to get there will be smoother. More insights on our views for the New Year can be found in Outlook 2021: Powering Forward. We wish you and your family a safe and wonderful New Year! Read previous editions of Weekly Market Commentary on lpl.com at News & Media. Ryan Detrick, CMT, Chief Market Strategist, LPL Financial
Nick Pergakis, Analyst, LPL Financial ______________________________________________________________________________________________ IMPORTANT DISCLOSURES This material is for general information only and is not intended to provide specific advice or recommendations for any individual. There is no assurance that the views or strategies discussed are suitable for all investors or will yield positive outcomes. Investing involves risks including possible loss of principal. Any economic forecasts set forth may not develop as predicted and are subject to change. References to markets, asset classes, and sectors are generally regarding the corresponding market index. Indexes are unmanaged statistical composites and cannot be invested into directly. Index performance is not indicative of the performance of any investment and do not reflect fees, expenses, or sales charges. All performance referenced is historical and is no guarantee of future results. Any company names noted herein are for educational purposes only and not an indication of trading intent or a solicitation of their products or services. LPL Financial doesn’t provide research on individual equities. All information is believed to be from reliable sources; however, LPL Financial makes no representation as to its completeness or accuracy. US Treasuries may be considered “safe haven” investments but do carry some degree of risk including interest rate, credit, and market risk. Bonds are subject to market and interest rate risk if sold prior to maturity. Bond values will decline as interest rates rise and bonds are subject to availability and change in price. The Standard & Poor’s 500 Index (S&P500) is a capitalization-weighted index of 500 stocks designed to measure performance of the broad domestic economy through changes in the aggregate market value of 500 stocks representing all major industries. The PE ratio (price-to-earnings ratio) is a measure of the price paid for a share relative to the annual net income or profit earned by the firm per share. It is a financial ratio used for valuation: a higher PE ratio means that investors are paying more for each unit of net income, so the stock is more expensive compared to one with lower PE ratio. Earnings per share (EPS) is the portion of a company’s profit allocated to each outstanding share of common stock. EPS serves as an indicator of a company’s profitability. Earnings per share is generally considered to be the single most important variable in determining a share’s price. It is also a major component used to calculate the price-to-earnings valuation ratio. All index data from FactSet. Please read the full Outlook 2021: Powering Forward publication for additional description and disclosure. This research material has been prepared by LPL Financial LLC. Securities and advisory services offered through LPL Financial (LPL), a registered investment advisor and broker-dealer (member FINRA/SIPC). Insurance products are offered through LPL or its licensed affiliates. To the extent you are receiving investment advice from a separately registered independent investment advisor that is not an LPL affiliate, please note LPL makes no representation with respect to such entity. Not Insured by FDIC/NCUA or Any Other Government Agency | Not Bank/Credit Union Guaranteed | Not Bank/Credit Union Deposits or Obligations | May Lose Value
RES-45807-1220 | For Public Use | Tracking # 1-05092965 (Exp. 01/22)