It’s been a very tough start to the year with both stocks and bonds down sharply. Adding to the “wall of worry” for investors are the highest levels of U.S. inflation in decades, an aggressive Federal Reserve (Fed), Chinese lockdowns, and continuing war in Europe. So perhaps it is no surprise that investor sentiment polls are showing signs of extreme pessimism. Extremes in sentiment tend to be contrarian indicators for the stock market over the short-to-medium-term, but have we really seen extreme pessimism yet? Below we look at some of the latest investor sentiment data and share our thoughts about the disparity between what investors are saying and what they are actually doing.
What Investors are Saying: Extreme Pessimism
When investors are asked their opinions about the outlook for the stock market, recent responses have been very bearish. The sentiment data derived from these surveys and polls has in some instances reached multi-decade levels of pessimism (which as a contrarian signal would be positive for markets): 1) AAII Investor Sentiment Survey. The individual investors surveyed weekly by the American Association of Individual Investors (AAII) have displayed extreme levels of pessimism in recent weeks. The readings in April included the lowest number of bullish investors in almost 30 years (15.8% on April 14) and the highest number of bearish investors since 2009 (59.4% on April 28). As shown in Figure 1, the spread between the number of investors who are bullish and those who are bearish has recently reached extreme levels not seen since 2009. In April the number of investors who said they were bullish was under 20% for three weeks in a row, which is only the second time this has occurred (the first was in 1988). When bulls have dropped below 20%, it’s tended to be a strong contrarian indicator of above average short-term returns ahead. As shown in Figure 2, when the number of bullish investors has fallen below 20% the forward three-month returns have been negative only twice and the forward six and 12-month returns negative only once (during the Great Financial Crisis of 2008-09). 2) Investors Intelligence Advisors Sentiment Report. This sentiment report surveys over 100 independent investment newsletters and reports the percentage of advisors that are bullish, bearish, and those that expect a correction. The ratio of bulls to bears dropped to 0.79 on May 3. Levels under 1 have typically been seen only toward the end of bear markets or corrections. 3) Barron’s Big Money Poll. This poll is taken twice a year, with the most recent poll closing in April and drawing 112 responses from professional money managers. When asked about their clients’ outlook for stocks, 24% said they were bearish, which was twice as many as the 12% who said their clients were bullish. Interestingly, when those same money managers were asked if they had been net buyers, net sellers, or had made no change to their U.S. equity allocation this year, only 21% were net sellers, which leads us to our next point.
What Investors are Doing: Selling but Not Panic Selling
The other type of sentiment data we look at is derived from actual market data to reveal what investors are actually doing. This data is showing some fear, but overall it is more subdued and has not yet hit levels consistent with the capitulation and indiscriminate selling that we normally see at market bottoms: 1) Chicago Board Options Exchange (CBOE) Put-Call Ratio. This measures the ratio of put options purchased by bearish market participants (those hedging against losses) to the number of call options purchased by bullish traders. Used as a contrarian indicator, a high ratio indicates the mood of the market may be overly bearish and stocks may rebound following indiscriminate selling. The five-day average of the total put-call ratio has been on the rise recently, but has still yet to reach the 1.2 level that we typically consider a signal, and is well short of the greater than 1.3 readings seen at the March 2020 and December 2018 market bottoms. 2) CBOE Volatility Index (VIX). The VIX is calculated by aggregating the weighted prices of put and call options placed on the S&P 500 Index and can be considered a measure of expected 30-day volatility of the U.S stock market. The VIX is often referred to as the “fear gauge” because it spikes in times of market worries and when stocks go down. At the start of May, the VIX reached around 36 intraday and closed at a similar level in early March but we would need to see the VIX hit at least 40 to signal that extreme fear was present among market participants.
Conclusion
Investor pessimism tends to be a contrarian signal for above-average expected stock market returns and can indicate that many sellers have already exited the market (likewise, extreme optimism can indicate there are not many remaining potential buyers). The more extreme the pessimism, the higher the expected returns, on average, as these extremes in pessimism often occur at market bottoms. The sentiment indicators, which ask investors for their opinions, are signaling extreme levels of pessimism, but indicators based on actual market data have not reached levels that are normally associated with stock market bottoms. Overall, our assessment is that negative sentiment is a positive signal for equities, but not yet at such extreme levels that we believe it sufficient to add risk. We continue to monitor sentiment data closely to see if investors are actually as pessimistic as they say they are. Further signs of extreme fear and panic selling in the market data may present a tactical opportunity to add to risk assets. We continue to prefer a modest overweight allocation to equities (tilting towards defensive sectors) and a slight underweight to fixed income relative to investors’ targets, as appropriate. Our year-end 2022 fair value target for the S&P 500 is 4,800–4,900 based on a price to earnings ratio of 20.5 and our 2023 S&P 500 earnings per share forecast of $235. George Smith, CFA, CAIA, CIPM, Quantitative Strategist, LPL Financial Scott Brown, CMT, Technical Market Strategist, LPL Financial Ryan Detrick, CMT, Chief Market Strategist, LPL Financial ______________________________________________________________________________________________ IMPORTANT DISCLOSURES This material is for general information only and is not intended to provide specific advice or recommendations for any individual. There is no assurance that the views or strategies discussed are suitable for all investors or will yield positive outcomes. Investing involves risks including possible loss of principal. Any economic forecasts set forth may not develop as predicted and are subject to change. References to markets, asset classes, and sectors are generally regarding the corresponding market index. Indexes are unmanaged statistical composites and cannot be invested into directly. Index performance is not indicative of the performance of any investment and does not reflect fees, expenses, or sales charges. All performance referenced is historical and is no guarantee of future results. Any company names noted herein are for educational purposes only and not an indication of trading intent or a solicitation of their products or services. LPL Financial doesn’t provide research on individual equities. All information is believed to be from reliable sources; however, LPL Financial makes no representation as to its completeness or accuracy. The Standard & Poor’s 500 Index (S&P500) is a capitalization-weighted index of 500 stocks designed to measure performance of the broad domestic economy through changes in the aggregate market value of 500 stocks representing all major industries. All index data from FactSet. This research material has been prepared by LPL Financial LLC. Securities and advisory services offered through LPL Financial (LPL), a registered investment advisor and broker-dealer (member FINRA/SIPC). Insurance products are offered through LPL or its licensed affiliates. To the extent you are receiving investment advice from a separately registered independent investment advisor that is not an LPL affiliate, please note LPL makes no representation with respect to such entity. Not Insured by FDIC/NCUA or Any Other Government Agency | Not Bank/Credit Union Guaranteed | Not Bank/Credit Union Deposits or Obligations | May Lose Value
RES-1149552-0522 | For Public Use | Tracking # 1-05278262 (Exp. 5/23)
First quarter earnings season is rolling. BlackRock, Delta Airlines, Goldman Sachs, JPMorgan Chase, and Morgan Stanley were among the first 16 S&P 500 companies to report March quarter results, following 20 index constituents with quarters ending in February that had already reported. Below we preview earnings season, highlight what we are watching, and share our latest thoughts on the 2022 profit outlook.
What to expect
We expect corporate America to again report earnings above consensus estimates in the first quarter. The consensus estimate is now calling for a 5% year-over-year increase in S&P 500 Index earnings per share, not an easy target by any stretch [Figure 1]. Pressure on profit margins from higher costs for virtually everything, notably labor, materials, and transportation, made this quarter difficult to navigate. Add spillover from the Russia-Ukraine conflict and intermittent COVID-19 lockdowns in China, and companies’ bottom lines are getting hit from several directions. Despite the tough environment, we believe the odds favor companies beating estimates as they have done historically on the back of double-digit revenue growth. High inflation translates into more revenue so earnings can grow at a solid pace even with some narrowing of profit margins. LPL Research expects S&P 500 revenue for the first quarter to rise 11% year over year, with energy and healthcare making the biggest contributions. Energy sector earnings are expected to contribute 5 percentage points of growth for the S&P 500—basically all of it based on current consensus estimates—and roughly 3 percentage points of revenue growth. Still, we probably will not get the 8 percentage points of upside S&P 500 companies delivered in the fourth quarter of 2021. Inflation, COVID-19, and geopolitical challenges have dampened the overall pace of economic activity in recent months and impaired profits. Meanwhile, the percentage of pre-announcing companies taking numbers down, at 70%, is above the five-year average of 60% and signals less potential upside. Nonetheless, upside of 3-4 percentage points seems like a reasonable expectation, or a year-over-year earnings gain of 8-9%.
What to Watch
Here are three things we are watching this earnings season—all inflation related—to help assess the near-term earnings outlook:
Margin pressures. This one is going to be highlighted in our earnings previews for a while. We will continue to watch for signs of pressure on profit margins from rising wages, costs of materials, energy, and transportation. Companies defied the skeptics (including ourselves) and held margins fairly steady in the fourth quarter. Market participants appear to be braced for lower margins in the first quarter so markets may not react negatively to modest deterioration—our expectation.
Pricing power. The inflationary environment has brought pricing power to many companies along with more revenue for commodity producers. This is evident in the double-digit revenue growth S&P 500 companies are expected to produce for the quarter. If companies are able to pass through their higher costs as they generally did in the fourth quarter, they should be able to hit their earnings targets pretty easily this quarter.
Supply chain status. Companies generally communicated that they expected most supply chain issues to be resolved by mid-2022, which now appears overly optimistic. While the progress toward containing COVID-19 is encouraging in the United States, China’s failures are keeping global supply chains snarled longer than many companies had anticipated.
Early thoughts on 2022 earnings
S&P 500 earnings estimates for 2022 have risen 2.2% this year to $228.50 per share (source: FactSet), which is remarkable considering how difficult the operating environment has become. We have sharply higher inflation, slower global growth, dampened consumer confidence, and a devastating war in Eastern Europe. Through that, analysts’ profit targets are rising, which means our $220 per share forecast for 2022 S&P 500 earnings (6-7% growth) is probably too low. The consensus estimate for the next 12 months is up to $235 per share, in line with our forecast for calendar 2023 [Figure 2]. However, we believe Wall Street’s estimates for 9-10% earnings growth this year are too high given the margin pressures noted above are likely to persist, and we have cut a full percentage point off of our forecasts for U.S. and global gross domestic product (GDP) since January 1. We would view a slight estimate cut during earnings season as a win, especially considering historically estimates are cut by about 3% as companies report results. So while the higher estimates are encouraging, we expect estimates to fall over the next couple quarters, which could lead to more choppiness for markets in the near term.
Conclusion
Earnings will be key to the path for stocks the rest of the year given that we believe valuation expansion will be tough to come by with higher interest rates and stubbornly high inflation. We expect S&P 500 earnings to grow in the high single-digits this year despite the challenges, supporting gains for stocks, in our view. But inflation is the most important factor for markets this year, as we noted here two weeks ago. Our expectation is that inflation pressures will soon start to abate, reducing the likelihood of an overly aggressive Federal Reserve and taking some of the wind out of the 10-year Treasury yield’s sails. The re-steepening of the 2-year/10-year Treasury yield curve is encouraging. We continue to recommend a modest overweight allocation to equities and a slight underweight to fixed income relative to investors’ targets, as appropriate. Our year-end 2022 fair value target for the S&P 500 is 4,800–4,900. Jeff Buchbinder, CFA, Equity Strategist, LPL Financial
Ryan Detrick, CMT, Chief Market Strategist, LPL Financial ______________________________________________________________________________________________ IMPORTANT DISCLOSURES This material is for general information only and is not intended to provide specific advice or recommendations for any individual. There is no assurance that the views or strategies discussed are suitable for all investors or will yield positive outcomes. Investing involves risks including possible loss of principal. Any economic forecasts set forth may not develop as predicted and are subject to change. References to markets, asset classes, and sectors are generally regarding the corresponding market index. Indexes are unmanaged statistical composites and cannot be invested into directly. Index performance is not indicative of the performance of any investment and does not reflect fees, expenses, or sales charges. All performance referenced is historical and is no guarantee of future results. Any company names noted herein are for educational purposes only and not an indication of trading intent or a solicitation of their products or services. LPL Financial doesn’t provide research on individual equities. All information is believed to be from reliable sources; however, LPL Financial makes no representation as to its completeness or accuracy. U.S. Treasuries may be considered “safe haven” investments but do carry some degree of risk including interest rate, credit, and market risk. Bonds are subject to market and interest rate risk if sold prior to maturity. Bond values will decline as interest rates rise and bonds are subject to availability and change in price. The Standard & Poor’s 500 Index (S&P500) is a capitalization-weighted index of 500 stocks designed to measure performance of the broad domestic economy through changes in the aggregate market value of 500 stocks representing all major industries. The PE ratio (price-to-earnings ratio) is a measure of the price paid for a share relative to the annual net income or profit earned by the firm per share. It is a financial ratio used for valuation: a higher PE ratio means that investors are paying more for each unit of net income, so the stock is more expensive compared to one with lower PE ratio. Earnings per share (EPS) is the portion of a company’s profit allocated to each outstanding share of common stock. EPS serves as an indicator of a company’s profitability. Earnings per share is generally considered to be the single most important variable in determining a share’s price. It is also a major component used to calculate the price-to-earnings valuation ratio. All index data from FactSet. This research material has been prepared by LPL Financial LLC. Securities and advisory services offered through LPL Financial (LPL), a registered investment advisor and broker-dealer (member FINRA/SIPC). Insurance products are offered through LPL or its licensed affiliates. To the extent you are receiving investment advice from a separately registered independent investment advisor that is not an LPL affiliate, please note LPL makes no representation with respect to such entity. Not Insured by FDIC/NCUA or Any Other Government Agency | Not Bank/Credit Union Guaranteed | Not Bank/Credit Union Deposits or Obligations | May Lose Value
RES-1125690-0422 | For Public Use | Tracking # 1-05268433 (Exp. 4/23)
Core bond investors have experienced one of the worst starts to the year ever, potentially calling into question the validity of bonds in a portfolio. Despite the poor start, we don’t think the value proposition for bonds has changed much. Moreover, with yields on most fixed income markets moving sharply higher, now could be a good time to revisit fixed income markets. Starting yields are still the best expectation of future returns and have become more attractive in a number of markets recently.
Has the value proposition of core bonds changed?
With most equity and fixed income markets down to start the year, a traditional 60/40 portfolio has come under pressure. Moreover, seeing both markets down simultaneously may cause investors to question the validity of a 60/40 portfolio broadly and core bonds specifically. For us, the value proposition for core bonds is that they tend to provide liquidity, diversification (to equity market risk), and positive total returns to portfolios. Unfortunately, none of those values are 100% certain all the time. Like all markets, fixed income investing involves risks and, at times, negative returns (although negative fixed income returns tend to be much smaller than negative equity returns). That said, as painful a start to the year as it has been for equity and core fixed income investors, it isn’t all that uncommon to experience negative returns for both equity and fixed income markets at the same time. In fact, since 1995, nearly 15% of monthly returns have had both negative equity and fixed income returns. Again, it doesn’t make the experience of a diversified portfolio any less painful this year, but we believe it also doesn’t change the argument to own core bonds in a portfolio. Moreover, with the economy likely in the middle of the economic cycle, the need for high-quality bonds actually increases, in our view. That is, the need to offset potential equity market volatility remains an important role for core fixed income. Bonds, particularly core bonds, have been less volatile than stocks and have historically provided a ballast to portfolios during equity market drawdowns, which as we know, are normal occurrences from time to time. The maximum drawdown for bonds, in any given month, has been dramatically less severe than stocks. While the worst drawdown in a month for equities was -28%, the worst bonds have done during a month was lose 6%, and those losses were quickly reversed. So, when combined with equities, bonds help reduce total portfolio volatility, which makes for a smoother investment experience for investors.
It’s all about the bond math
Fixed income instruments, for the most part, are unique in their structures in that, absent defaults, expected returns are largely determined by starting yields. That is, we tend to have a pretty good idea what to expect out of many fixed income instruments over time because coupon and principal payments are known in advance and are contractually obligated. As such, whether you’re invested in an individual bond, an investment that tracks an index like the Bloomberg Aggregate index [Figure 1] or a strategy designed to actively outperform an index, returns are largely predicated on starting yields. And this is true if you hold the fixed income instrument to maturity (for an individual bond) or at least five years (for a portfolio of bonds) regardless of what interest rates do in the interim. An important point about the negative returns we’re seeing this year is that yields are moving higher because of the expectations of higher short-term interest rates and not an increase in credit risk. Fixed income markets repriced, rather quickly, the prospects of accelerated Federal Reserve (Fed) rate hikes this year. Towards the end of 2021, fixed income markets only expected one or two rate hikes this year, but in January and February, markets have priced in seven hikes this year. This quick adjustment in expectations caused yields across the curve to move higher. However, there is a huge distinction between yields moving higher due to the prospects of higher short-term interest rates versus yields moving higher because of higher credit/default risks, which could represent permanent impairments of capital. As shown above, absent defaults, starting yields represent the best expectation for future returns regardless of what interest rates do. That is, if you buy and hold a fixed income investment, the short-term volatility you experience due to changing interest rate expectations is just volatility. It has very little bearing on the actual total return if held to maturity (or if held to the average maturity of a portfolio of bonds). If you consider the historical returns of the Bloomberg Aggregate Bond Index, the overwhelming majority of returns came from coupon income and not price returns (which is generally the opposite of equity investments). For example, over the last five years, the index returned 12.52%, on a cumulative basis, of which price volatility only detracted by -0.75% over the entire five years (and that includes this year as well). Coupon and principal payments are much more important than price volatility.
What goes down, must go up?
What has been characterized as a bond bull market, bond yields have seemingly only fallen from very lofty levels over the past 40 years [Figure 2]. Long-term yields peaked above 15%, in the early 1980s and have fallen to a little over 2% currently. Because interest rates are seemingly bound by zero in the U.S. (although there remains over $3 trillion in negative yielding debt globally), some investors are wondering if the only way is up for interest rates (which would mean negative bond prices). We remain unconvinced. Moreover, just because a bull market ends, either in equities or bonds, doesn’t automatically mean a new bear market must immediately follow. However, that yields have continued to fall over time are due to a number of structural reasons, which, we think remain in place and should keep U.S. Treasury yields from persistently increasing. These factors include:
Demographics- A primary reason for the continued march lower in bond yields, especially over the past 20 years, has been aging global demographics and, more specifically, the need for income. That hasn’t changed. The need for safe, reliable income is as high as it’s ever been and should keep yields from going too much higher.
Global Debt dynamics- With over $225 trillion in debt globally (IMF), elevated debt levels limit economic growth potential especially as debt service costs increase. Lower interest rates are actually correlated with lower economic growth.
Dis-Inflation- Due to a number of factors, inflation has fallen over the past 40 years. Certainly, the inflationary pressures we’re seeing now should give core fixed income investors pause and remain the wildcard for higher yields. However, with central bankers around the world embarking on rate increases to arrest high consumer prices, we don’t believe we are in a new, higher inflationary regime. Moreover, longer-term market implied inflation expectations remain well within historical ranges, suggesting inflationary pressures should abate over time.
Flight to safety- Core bonds and, more specifically, U.S. Treasury securities continue to be the best diversifier to broad-based equity market sell-offs, which tend to happen when the economy slows or there are macroeconomic shocks. When we look at how Treasury securities have performed during periods of equity market selloffs, Treasury security returns have been mostly positive—although not every time. But in every situation, Treasury securities outperformed equities, which means an allocation to Treasury securities would have both improved portfolio returns and reduced portfolio volatility during these periods.
Active fixed income management- With trillions invested with active fixed income managers, any move higher in yields, absent an increase in default expectations, presents an investment opportunity. Additionally, because of strong equity market returns over the last few years, private pension funds are well-funded and are actively de-risking portfolios by buying long-term bonds. According to the Organization for Economic Co-operation and Development (OECD), there are $35 trillion in pension fund assets with most of these plans fully funded. This could provide a tailwind to bond prices.
Time to buy the dip?
Firmly ingrained, at least recently, in equity investors has been this buy the dip mentality. However, it may not be as ingrained in retail bond investors although maybe it should be. As noted above, future returns, absent defaults, are largely determined by starting yields, regardless of what the interest rate and inflationary environments look like. And with yields moving higher recently in most fixed income markets, future returns for fixed income investors have improved. We’re seeing increasing investment opportunities in a number of shorter maturity securities (since yields on shorter maturity securities have moved up the most) such as short maturity investment grade corporates and Treasury securities and lower rated corporate credit. Moreover, with yields on the core bond index now back up close to its longer-term average, core fixed income broadly is more attractive.
Conclusion
Core bonds have been a staple in diversified asset allocations. However, with returns as negative as they’ve been this year, investors may be undergoing a rethink of the utility of core bonds. We think that may be a mistake. We still think the value proposition for core bonds remains. Liquidity, equity diversification, and total returns are all valuable properties core bonds bring to diversified portfolios. Moreover, bonds are unique in their structures in that coupon and principal payments are, for the most part, guaranteed and the primary factors of long-term total returns. The price volatility we’ve seen so far this year doesn’t impact those payments. And with yields higher in many markets, now may be a good time to start looking at additional investment opportunities within fixed income. Lawrence Gillum, CFA, Fixed Income Strategist, LPL Financial Ryan Detrick, CMT, Chief Market Strategist, LPL Financial ______________________________________________________________________________________________ IMPORTANT DISCLOSURES This material is for general information only and is not intended to provide specific advice or recommendations for any individual. There is no assurance that the views or strategies discussed are suitable for all investors or will yield positive outcomes. Investing involves risks including possible loss of principal. Any economic forecasts set forth may not develop as predicted and are subject to change. References to markets, asset classes, and sectors are generally regarding the corresponding market index. Indexes are unmanaged statistical composites and cannot be invested into directly. Index performance is not indicative of the performance of any investment and do not reflect fees, expenses, or sales charges. All performance referenced is historical and is no guarantee of future results. Any company names noted herein are for educational purposes only and not an indication of trading intent or a solicitation of their products or services. LPL Financial doesn’t provide research on individual equities. All information is believed to be from reliable sources; however, LPL Financial makes no representation as to its completeness or accuracy. US Treasuries may be considered “safe haven” investments but do carry some degree of risk including interest rate, credit, and market risk. Bonds are subject to market and interest rate risk if sold prior to maturity. Bond values will decline as interest rates rise and bonds are subject to availability and change in price. The Standard & Poor’s 500 Index (S&P500) is a capitalization-weighted index of 500 stocks designed to measure performance of the broad domestic economy through changes in the aggregate market value of 500 stocks representing all major industries. The PE ratio (price-to-earnings ratio) is a measure of the price paid for a share relative to the annual net income or profit earned by the firm per share. It is a financial ratio used for valuation: a higher PE ratio means that investors are paying more for each unit of net income, so the stock is more expensive compared to one with lower PE ratio. Earnings per share (EPS) is the portion of a company’s profit allocated to each outstanding share of common stock. EPS serves as an indicator of a company’s profitability. Earnings per share is generally considered to be the single most important variable in determining a share’s price. It is also a major component used to calculate the price-to-earnings valuation ratio. All index data from FactSet. This research material has been prepared by LPL Financial LLC. Securities and advisory services offered through LPL Financial (LPL), a registered investment advisor and broker-dealer (member FINRA/SIPC). Insurance products are offered through LPL or its licensed affiliates. To the extent you are receiving investment advice from a separately registered independent investment advisor that is not an LPL affiliate, please note LPL makes no representation with respect to such entity. Not Insured by FDIC/NCUA or Any Other Government Agency | Not Bank/Credit Union Guaranteed | Not Bank/Credit Union Deposits or Obligations | May Lose Value
RES-1094501-0322 | For Public Use | Tracking # 1-05257812 (Exp. 3/23)
With inflationary pressures running higher than many central bankers are comfortable with, calls for interest rate hikes have become louder. A number of important central bank meetings are set to take place in March including the Federal Reserve, European Central Bank, Bank of Canada, Bank of England, and the Reserve Bank of Australia, to name a few. As such, March could be an important month for monetary policy shifts. The COVID-19 pandemic was an unprecedented shock across the global economy. But the economic damage was met with an extraordinary global monetary response with central banks cutting rates to near zero levels and expanding balance sheets by nearly $10 trillion to provide additional levels of monetary accommodation. Moreover, governments around the world provided fiscal support and, on average, annual spending increased by 7% of gross domestic product (Bloomberg). As economies have recovered and the impact of COVID-19 fades, these extraordinary levels of monetary accommodation are no longer necessary, and thus we’re likely to see the active removal of monetary support. While these extraordinary fiscal and monetary measures certainly helped stave off broader economic weakness, these tailwinds are likely to become marginal headwinds to the global economy in the upcoming years. Additionally, a confluence of events has raised inflationary pressures to the highest in several decades. Direct fiscal stimulus gave discretionary funds to consumers, which instantaneously boosted demand, especially for consumer goods as most people were spending much less on services during the pandemic. The quick rebound in consumer goods spending put stress on the logistics and transportation sectors, crimping supply and thereby creating an upward spiral on prices. Moreover, due to continued price pressures (as defined by each respective country’s Consumer Price Index) that remain above central bank targets, global central banks began wrestling with the conundrum of a fragile economy coupled with rising prices [Figure 1]. With inflationary pressures running higher than most central bankers are comfortable with, calls for interest rate hikes have become louder. A number of important central bank meetings are set to take place in March, including the Federal Reserve (Fed), European Central Bank (ECB), Bank of Canada (BOC), Bank of England (BOE), and the Reserve Bank of Australia (RBA). As such, March could be an important month for monetary policy shifts. And while many central banks have stopped providing forward guidance on an actual plan to raise short-term interest rates, markets have already priced in a number of interest rate hikes over the next 12 months. As seen in [Figure 2], market expectations for rate hikes are broadly expected and include fairly significant rate hiking campaigns for the BOC, BOE, and the Fed over the next year. Markets expect these central banks to increase interest rates five to seven times over the course of a year, which seems fairly aggressive to us. Moreover, markets are expecting somewhat divergent policy rate paths after the second year of rate hikes. Specifically, markets are expecting the U.K. and U.S. to cut interest rates in 2024. Interest rate cuts tend to happen around broad market stresses or while at the precipice of a recession. It should be noted that these market-implied expectations are volatile and expectations can and do change over time. Our view remains that interest rate hikes for the U.S. will likely begin in March with a 25 basis point (0.25%) hike and then three to four more rate hikes at subsequent meetings in 2022. Moreover, we think the Fed will start to reduce its nearly $9 trillion balance sheet in the second half of 2022. There is a risk to the upside (in hikes) depending on the trajectory of inflationary pressures. If consumer price pressures moderate over the course of the year, as we and the Fed expect, then we think the Fed and other central bankers can take a more moderate approach to interest rate hikes. However, if inflationary pressures remain stubbornly high and, importantly, we start to see longer-term inflation expectations become unanchored, central bankers may be forced to move more aggressively than what is already priced in. That said, given the current conflict in the Ukraine, there remains considerable near term uncertainty with central bank intentions. Additionally, upward pressure on commodity prices, already impacted by COVID-19-related supply chain disruptions, may see a more sustained impact as economic sanctions play out and will probably be the main source of risk for possible broader economic repercussions. As such, inflationary pressures may remain high particularly as it relates to gas prices. Finally, and we can’t stress this enough, these views and opinions are secondary to the conflict taking place in Ukraine. While our primary job is to provide investment advice, we certainly recognize that there is an immediate humanitarian crisis taking place in eastern Europe. We hope the conflict ends quickly and offer our thoughts to those impacted. Lawrence Gillum, CFA, Fixed Income Strategist, LPL Financial Ryan Detrick, CMT, Chief Market Strategist, LPL Financial ______________________________________________________________________________________________ IMPORTANT DISCLOSURES This material is for general information only and is not intended to provide specific advice or recommendations for any individual. There is no assurance that the views or strategies discussed are suitable for all investors or will yield positive outcomes. Investing involves risks including possible loss of principal. Any economic forecasts set forth may not develop as predicted and are subject to change. References to markets, asset classes, and sectors are generally regarding the corresponding market index. Indexes are unmanaged statistical composites and cannot be invested into directly. Index performance is not indicative of the performance of any investment and do not reflect fees, expenses, or sales charges. All performance referenced is historical and is no guarantee of future results. Any company names noted herein are for educational purposes only and not an indication of trading intent or a solicitation of their products or services. LPL Financial doesn’t provide research on individual equities. All information is believed to be from reliable sources; however, LPL Financial makes no representation as to its completeness or accuracy. US Treasuries may be considered “safe haven” investments but do carry some degree of risk including interest rate, credit, and market risk. Bonds are subject to market and interest rate risk if sold prior to maturity. Bond values will decline as interest rates rise and bonds are subject to availability and change in price. The Standard & Poor’s 500 Index (S&P500) is a capitalization-weighted index of 500 stocks designed to measure performance of the broad domestic economy through changes in the aggregate market value of 500 stocks representing all major industries. The PE ratio (price-to-earnings ratio) is a measure of the price paid for a share relative to the annual net income or profit earned by the firm per share. It is a financial ratio used for valuation: a higher PE ratio means that investors are paying more for each unit of net income, so the stock is more expensive compared to one with lower PE ratio. Earnings per share (EPS) is the portion of a company’s profit allocated to each outstanding share of common stock. EPS serves as an indicator of a company’s profitability. Earnings per share is generally considered to be the single most important variable in determining a share’s price. It is also a major component used to calculate the price-to-earnings valuation ratio. All index data from FactSet. This research material has been prepared by LPL Financial LLC. Securities and advisory services offered through LPL Financial (LPL), a registered investment advisor and broker-dealer (member FINRA/SIPC). Insurance products are offered through LPL or its licensed affiliates. To the extent you are receiving investment advice from a separately registered independent investment advisor that is not an LPL affiliate, please note LPL makes no representation with respect to such entity. Not Insured by FDIC/NCUA or Any Other Government Agency | Not Bank/Credit Union Guaranteed | Not Bank/Credit Union Deposits or Obligations | May Lose Value
RES-1066650-0222 | For Public Use | Tracking # 1-05248727 (Exp. 2/23)
“Sell in May and go away” is probably the most widely cited stock market cliché in history. Every year a barrage of Wall Street commentaries, media stories, and investor questions flood in about the popular stock market adage. In this week’s Weekly Market Commentary, we tackle this commonly cited seasonal pattern and why it might not play out this year, similar to recent years.
The Worst Six Months of the Year
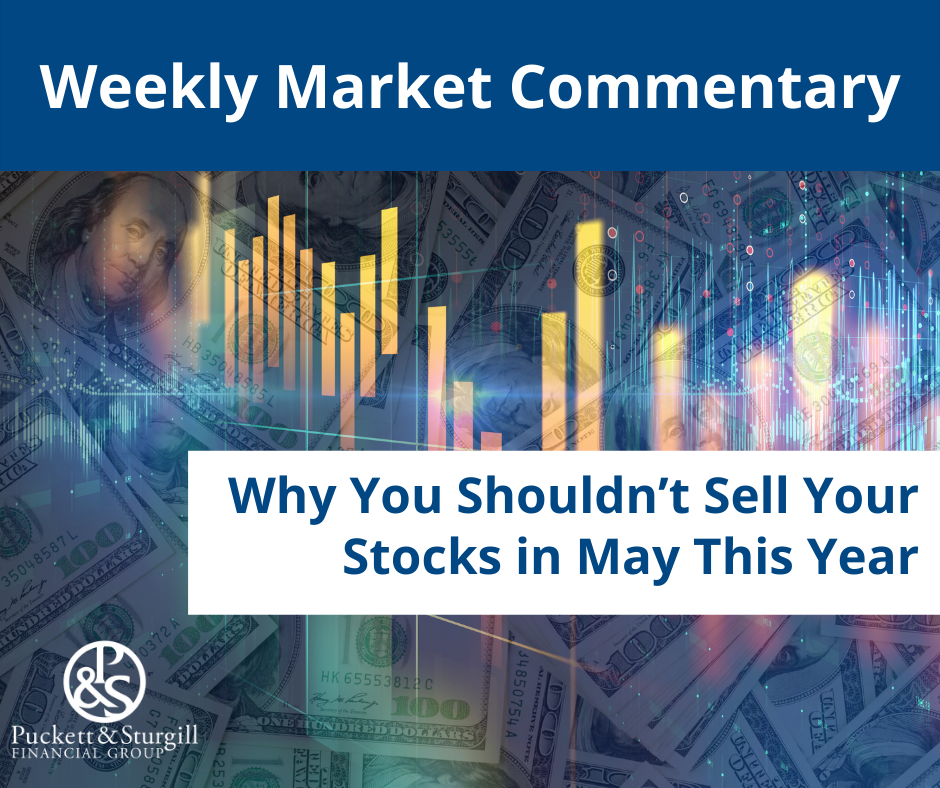
“Sell in May and go away” is the seasonal stock market pattern in which the six months from May through October are historically weak for stocks, with many investors believing that it’s better to avoid the market altogether by selling in May and moving to cash during the summer months. “Sell in May and go away” began in England originally as “sell in May and go away until St. Leger’s Day.” The saying was based around the St. Leger Stakes, a popular horse race in September that marked the end of summer and a return of the big traders and market volume. As [Figure 1] shows, since 1950 the S&P 500 Index has gained 1.8% on average during these six months, compared with 7.1% during the November to April period. In fact, out of all six-month combinations, the May through October period has produced the weakest—and least positive—average return. But as with many things in life, it is never that simple.
What have you done for me lately?
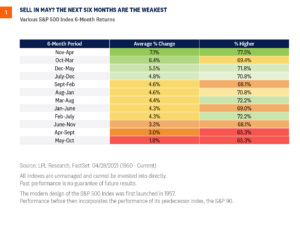
As we head into this seasonally weak period, keep a few things in mind. First, the S&P 500 Index has closed higher during the month of May in eight of the past nine years—so “Sell in June” might be more appropriate. In addition, various sentiment signals we follow are showing extreme caution and fear, potentially bullish from a contrarian point of view. The CBOE VIX Index (VIX) recently spiked above 30, consistent with stock market lows. Various sentiment polls are flashing extreme fear, while money managers are sitting on a good deal of cash as well. Lastly, we don’t see a recession in 2022, and despite lackluster Q1 gross domestic product (GDP) reported on April 28, we continue to expect economic growth of 3% this year, led by strong corporate earnings, accelerating business investment, and a healthy consumer. Here’s the catch—and there’s always a catch: These ‘worst six months of the year’ have been quite strong lately. In fact, stocks gained nine of the past 10 years during these six months, as you can see in [Figure 2]. So, although our guard is up for some potential seasonal weakness and choppy action, be aware it could be short-lived and consider using it as a buying opportunity.
Is this actually normal?
Clearly 2022 has been one of the worst starts to a year ever for stocks, but how rare is it? Here are some statistics to potentially help calm some nerves.
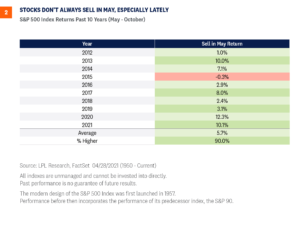
The S&P 500 Index has fallen 13.9% peak to trough this year, near the 14% average of all years since 1980. In other words, this year is fairly average so far.
During midterm election years, the average stock market correction is 17%, but stocks rebounded 32% on average in the 12 months following those midterm year lows.
Of the last 21 times the S&P 500 has corrected double-digits in a given year since 1980, stocks rallied back to end the year positive 12 times.
During those 12 positive years, the average gain at the end of the year has been a stellar 17%.
As [Figure 3] shows, the correction so far in 2022 is line with an average correction.
Conclusion
The media will have fun with the “Sell in May” warning to drive up clicks and views. Although you can’t argue that these months historically have been weak, they still sport a positive return, so totally going away may not be wise. With sentiment flashing extreme caution, a healthy consumer, and strong corporate earnings, going away this May is something we would not subscribe to. We continue to prefer a modest overweight allocation to equities and a slight underweight to fixed income relative to investors’ targets, as appropriate. Our year-end 2022 fair value target for the S&P 500 is 4,800–4,900, based on a price-to-earnings ratio of 20.5, and our 2023 S&P 500 earnings forecast of $235 per share. Ryan Detrick, CMT, Chief Market Strategist, LPL Financial Jeff Buchbinder, CFA, Equity Strategist, LPL Financial ______________________________________________________________________________________________ IMPORTANT DISCLOSURES This material is for general information only and is not intended to provide specific advice or recommendations for any individual. There is no assurance that the views or strategies discussed are suitable for all investors or will yield positive outcomes. Investing involves risks including possible loss of principal. Any economic forecasts set forth may not develop as predicted and are subject to change. References to markets, asset classes, and sectors are generally regarding the corresponding market index. Indexes are unmanaged statistical composites and cannot be invested into directly. Index performance is not indicative of the performance of any investment and does not reflect fees, expenses, or sales charges. All performance referenced is historical and is no guarantee of future results. Any company names noted herein are for educational purposes only and not an indication of trading intent or a solicitation of their products or services. LPL Financial doesn’t provide research on individual equities. All information is believed to be from reliable sources; however, LPL Financial makes no representation as to its completeness or accuracy. The CBOE VIX is a measure of the volatility implied in the prices of options contracts for the S&P 500. It is a market-based estimate of future volatility. When sentiment reaches one extreme or the other, the market typically reverses course. While this is not necessarily predictive it does measure the current degree of fear present in the stock market. The Standard & Poor’s 500 Index (S&P500) is a capitalization-weighted index of 500 stocks designed to measure performance of the broad domestic economy through changes in the aggregate market value of 500 stocks representing all major industries. The PE ratio (price-to-earnings ratio) is a measure of the price paid for a share relative to the annual net income or profit earned by the firm per share. It is a financial ratio used for valuation: a higher PE ratio means that investors are paying more for each unit of net income, so the stock is more expensive compared to one with lower PE ratio. Earnings per share (EPS) is the portion of a company’s profit allocated to each outstanding share of common stock. EPS serves as an indicator of a company’s profitability. Earnings per share is generally considered to be the single most important variable in determining a share’s price. It is also a major component used to calculate the price-to-earnings valuation ratio. All index data from FactSet. This research material has been prepared by LPL Financial LLC. Securities and advisory services offered through LPL Financial (LPL), a registered investment advisor and broker-dealer (member FINRA/SIPC). Insurance products are offered through LPL or its licensed affiliates. To the extent you are receiving investment advice from a separately registered independent investment advisor that is not an LPL affiliate, please note LPL makes no representation with respect to such entity. Not Insured by FDIC/NCUA or Any Other Government Agency | Not Bank/Credit Union Guaranteed | Not Bank/Credit Union Deposits or Obligations | May Lose Value
RES-1141600-0422 | For Public Use | Tracking # 1-05274661 (Exp. 4/23)
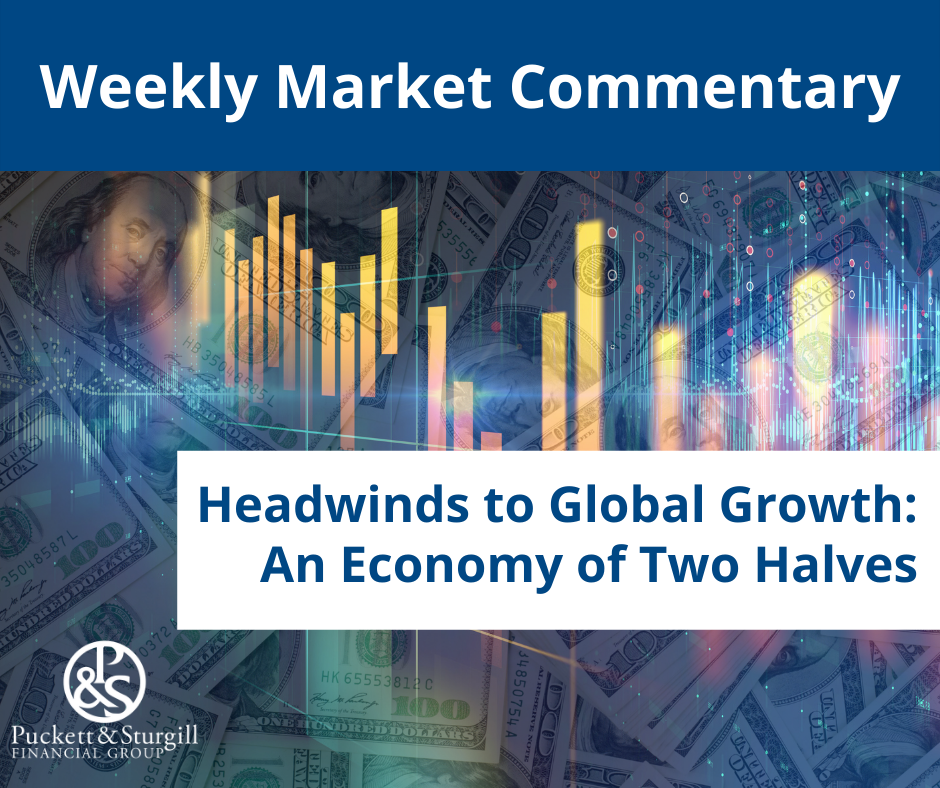
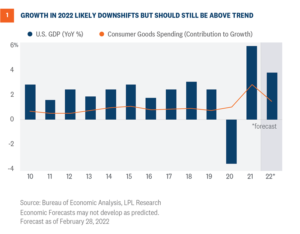
LPL Research reduced U.S. and global GDP forecasts due to Russian commodity disruptions, elevated inflation dynamics, and higher borrowing costs. Still, we expect the U.S. economy to grow 2.7-3.2% in 2022, supported by business investment and consumer services spending in the latter half of this year. Forecasts for GDP growth in developed economies excluding the U.S. and emerging markets were also reduced this month to 2.5–3% and 3.8–4.3% respectively, bringing the LPL Research global GDP growth forecast down about one percentage point to 3–3.5%.
Tale of Two Halves
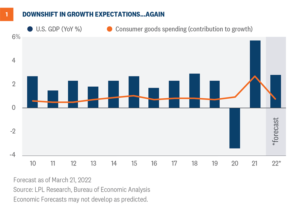
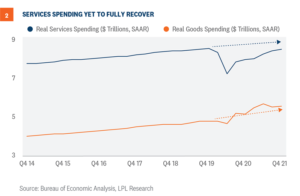
This year, many aspects of the economy will likely be told as tales of two halves. Economic growth during the first half of this year will likely be different than the second half. Moreover, inflation pressures affect the lower half of the consumer base differently than the upper half. As the country adjusts to pandemic reshuffling and rising mortgage rates, we will likely observe greater regional and demographic divergence within the housing market. Overall, the first half of this year will likely drag on 2022 U.S. economic growth while the second half of the year could rebound if global conditions improve. We started this year with a variant strain of COVID-19, and consumers and businesses alike pulled back spending. Before the economy could recover, geopolitical tensions snapped from Russia’s decision to invade Ukraine. Commodity prices rose to record levels, some markets temporarily closed, and fixed income markets responded to a new paradigm. Globally-coordinated sanctions will impact markets for as long as Russia’s war remains. Because of geopolitical conflict and persistent inflation pressures, we revised our U.S. GDP forecast again in March after a downward revision in February. We now expect the U.S. to grow 2.7–3.2% in 2022, as noted in our latest Global Portfolio Strategy report. Last year, as the economy rebounded from the lockdowns, consumers concentrated spending on goods versus services, which translated into an outsized contribution to growth [Figure 1]. As consumers pivot to services spending, the 2022 growth estimate will have support from a rebound in services spending in addition to strong business investment. Consumers likely have pent up demand for services foregone since March 2020. If spending patterns revert to trends, the economy will have $500 billion added to the consumer services component of GDP [Figure 2]. The forecast is also predicated on wage growth from a tight labor market and households flush with cash.
Consumer Confidence Implies Weakness, Not Necessarily Recession
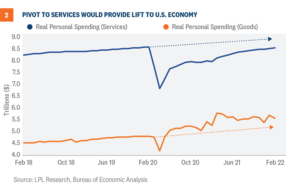
Recent consumer surveys point to weakness for the first half of this year but a rebound in the second half is still possible. Both Conference Board and University of Michigan surveys reveal a burden on consumers, particularly from pricing pressures. Surprisingly, buying plans within the next six months for big-ticket items such as cars and houses are at or above trend. The headline Consumer Confidence Index is lower than recent months, but a decline in consumer confidence does not always foreshadow an imminent recession [Figure 3]. The Index fell in the mid-1980s and throughout the 1990s, and recessions did not immediately follow. On the contrary, during the late 1980s, consumer confidence steadily rose after the low point in January 1987. Even though recession risks are rising, the LPL Research base case scenario is no recession in the U.S. this year, assuming the Federal Reserve (Fed) does not overtighten and supply constraints ease, to list just a few risks to growth. The weak survey in January and February is consistent with the overall narrative that first quarter GDP growth will be very low, but if inflation pressures subside and the labor market remains solid, GDP growth should recover in the latter half of the year.
Higher Expected Treasury Yields
Core bonds (as measured by the Bloomberg Aggregate index) have had the worst start to the year since the 1980s due to a significant repricing of Fed rate hike expectations. At the end of September 2021, markets were expecting only one 25 basis point (0.25%) rate hike this year, but markets are now expecting the Fed to hike short-term interest rates by 250 basis points (2.50%). This has caused U.S. Treasury yields, across the curve, to move meaningfully higher this year. At 2.60% (as of 4/07/22), the 10-year Treasury yield has already increased by over 1.1% this year and by over 2% from the August 2020 low of 0.50%. As markets are forward-looking, this move higher in yields due to expected interest rate hikes is consistent with past rate hiking campaigns and suggest we may be near the peak in yields for this cycle. In each of the last three Fed rate hiking campaigns for example, the 10-year Treasury yield moved more ahead of the hikes than during the hikes. The fed funds rate was raised by 175 basis points, 425 basis points, and 225 basis points each of last three cycles while the 10-year Treasury yield moved higher by just 62 basis points, 60 basis points, and 47 basis points, respectively. So that said, as inflationary pressures have broadened this year, and with the Fed likely forced to tighten monetary policy quicker than we originally expected, we now expect the 10-year Treasury yield to end the year between 2.25% and 2.50% with risks to the upside. As this is a yearend target, there is a high likelihood that yields could get as high as 2.75%-3.00% in the near term, depending on the path of inflation over the summer months. If inflationary pressures remain stubbornly high, forcing the Fed to follow through with rate hike expectations, yields could continue to climb marginally higher, which is consistent with history. However, if inflationary pressures fade over the course of the year, potentially resulting in a less aggressive rate hiking campaign, it’s likely that yields could move back down to around current levels, which is our expectation. An additional consideration, though, is if the Fed is forced to hike rates more aggressively than markets are expecting, there is a possibility that recessionary risks are pulled forward into 2023, which could cause interest rates to move lower than current levels. Given the three potential scenarios, we think the biggest move higher in yields has likely already happened but we do think elevated levels of volatility are likely to remain.
Conclusion
Due to a confluence of factors, we expect slower economic growth in the U.S. and globally. Fully functioning supply chains, restored relationships in Eastern Europe, and improving inflation metrics are all key factors for our baseline forecast. Growth in the latter half of the year will likely come from business fixed investment and consumer services spending as both commodity markets and fixed income markets settle into the post-pandemic central bank tightening cycle. Jeffrey Roach, PhD, Chief Economist, LPL Financial Lawrence Gillum, CFA, Fixed Income Strategist, LPL Financial ______________________________________________________________________________________________ IMPORTANT DISCLOSURES This material is for general information only and is not intended to provide specific advice or recommendations for any individual. There is no assurance that the views or strategies discussed are suitable for all investors or will yield positive outcomes. Investing involves risks including possible loss of principal. Any economic forecasts set forth may not develop as predicted and are subject to change. References to markets, asset classes, and sectors are generally regarding the corresponding market index. Indexes are unmanaged statistical composites and cannot be invested into directly. Index performance is not indicative of the performance of any investment and does not reflect fees, expenses, or sales charges. All performance referenced is historical and is no guarantee of future results. Any company names noted herein are for educational purposes only and not an indication of trading intent or a solicitation of their products or services. LPL Financial doesn’t provide research on individual equities. All information is believed to be from reliable sources; however, LPL Financial makes no representation as to its completeness or accuracy. U.S. Treasuries may be considered “safe haven” investments but do carry some degree of risk including interest rate, credit, and market risk. Bonds are subject to market and interest rate risk if sold prior to maturity. Bond values will decline as interest rates rise and bonds are subject to availability and change in price. The Standard & Poor’s 500 Index (S&P500) is a capitalization-weighted index of 500 stocks designed to measure performance of the broad domestic economy through changes in the aggregate market value of 500 stocks representing all major industries. The PE ratio (price-to-earnings ratio) is a measure of the price paid for a share relative to the annual net income or profit earned by the firm per share. It is a financial ratio used for valuation: a higher PE ratio means that investors are paying more for each unit of net income, so the stock is more expensive compared to one with lower PE ratio. Earnings per share (EPS) is the portion of a company’s profit allocated to each outstanding share of common stock. EPS serves as an indicator of a company’s profitability. Earnings per share is generally considered to be the single most important variable in determining a share’s price. It is also a major component used to calculate the price-to-earnings valuation ratio. All index data from FactSet. This research material has been prepared by LPL Financial LLC. Securities and advisory services offered through LPL Financial (LPL), a registered investment advisor and broker-dealer (member FINRA/SIPC). Insurance products are offered through LPL or its licensed affiliates. To the extent you are receiving investment advice from a separately registered independent investment advisor that is not an LPL affiliate, please note LPL makes no representation with respect to such entity. Not Insured by FDIC/NCUA or Any Other Government Agency | Not Bank/Credit Union Guaranteed | Not Bank/Credit Union Deposits or Obligations | May Lose Value
RES-1120754-0422 | For Public Use | Tracking # 1-05266415 (Exp. 4/23)
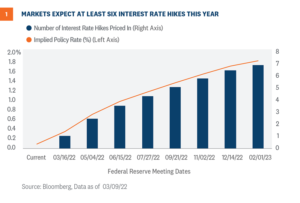
The Federal Reserve (Fed) meets this week and in all likelihood will raise short-term interest rates for the first time since emergency levels of monetary accommodation were provided to markets after the COVID-19 shutdowns. Inflationary pressures are running higher than the central bankers are comfortable with, but the conflict in Eastern Europe adds to the uncertain path of policy normalization. Prospects of yield curve inversion make the Fed’s job trickier.
Interest Rate Hikes Are (Likely) Coming
The Federal Reserve is widely expected to increase short-term interest rates this week for the first time since emergency levels of monetary support were enacted in the aftermath of the COVID-19 shutdowns. With its asset purchase programs fully winding down last week (the Fed was buying $120 billion a month of U.S. Treasury and mortgage securities), the Fed has signaled that it is ready to take the next step towards policy normalization and is set to start a series of interest rate hikes over the coming years. How many rate hikes and how quickly the Fed gets back to a neutral policy rate—the interest rate that neither stimulates nor restrains economic growth—is still uncertain. As seen in Figure 1, markets expect the Fed to raise interest rates at least six times this year, which would bring the policy rate to between 1.50% and 1.75%. It should be noted that these market-implied expectations are volatile and expectations can and do change over time. Our view remains that Fed interest rate hikes will likely begin this week with a 25 basis point (0.25%) increase and then three to four more rate hikes at subsequent meetings in 2022. Moreover, we think the Fed will start to reduce its nearly $9 trillion balance sheet in the second half of 2022. There is a risk to the upside (in hikes) depending on the trajectory of inflationary pressures. If consumer price pressures moderate over the course of the year as we and the Fed expect, then we think the Fed can take a more gradual approach to interest rate hikes. However, if inflationary pressures remain stubbornly high and we start to see longer-term inflation expectations become unanchored (more on this below), the Fed may be forced to move more aggressively than what is even already priced in. The Committee will also release individual meeting participants’ projections for real gross domestic product (GDP) growth, the unemployment rate, and inflation for the next several years, as well as its longer-term forecasts. It’s largely expected that the Fed will confirm that we are near/at full employment and that the strong labor market can handle a series of interest rate hikes. The Fed will also likely adjust its forecast for GDP growth down (from December’s forecast of 4.0% GDP growth in 2022) and its forecasts for inflation up (with PCE headline and core metrics, their preferred inflation measures, at 2.6% and 2.7% back in December). However, the Committee will likely maintain its stance that inflation will fall back to its longer-term trend in 2023.
Has The Fed Lost Control Of The Inflation Narrative?
Inflation expectations are informative about how the current inflation experience has shaped the public’s views regarding future inflation. And the Fed pays close attention to how these expectations change over time. De-anchored inflation expectations tend to make further inflationary pressures self-fulfilling. So, it’s notable that the Fed’s January Survey of Consumer Expectations (the most recent one available) showed a decrease in short and medium-term inflation expectations. While still elevated, falling consumer expectations about future consumer price increases is encouraging. Moreover, longer-term market-implied inflation expectations are in line with historical averages. It seems that, despite the elevated inflation readings we’ve seen over the past few months, markets and consumers still expect price pressures to abate, which could allow the Fed to take a more moderate approach to interest rate hikes.
Geopolitics Add Uncertainty To Policy Normalization
Complicating the expected path of policy normalization, however, is the ongoing conflict in Ukraine. As sanctions and boycotts continue against Russia, which is the world’s third largest oil producer, we may see continued upward pressure on commodity prices, on top of the inflation effects already in place from COVID-19-related supply chain disruptions. Additionally, Ukraine and Russia together account for more than a quarter of global trade of wheat. The conflict has closed major ports in Ukraine and severed logistics and transport links. As such, the negative impact to global trade, both energy and ex-energy, are likely to weigh on the prospects for global economic growth, at least in the near term. This heightened uncertainty and potential shock to financial and economic growth trajectories further complicate the Fed’s ability to aggressively raise short-term interest rates. That said, while we think the Fed will be less hawkish than it otherwise would be due to the ongoing conflict in Eastern Europe, price stability is one of its primary mandates. So, as long as inflation pressures remain above the Fed’s inflation target, we think the Fed will continue along the path of policy normalization.
Will Fed Rate Hikes invert the Yield Curve?
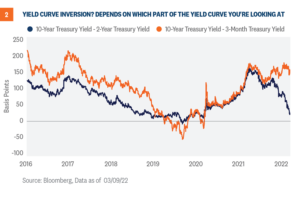
One of the big risks associated with Fed rate hikes, though, is when the Fed funds rate is pushed higher than longer-term Treasury yields. In this instance, the yield curve becomes inverted, which means shorter maturity securities out-yield longer maturity securities. Generally, the opposite is true and the yield curve is upward sloping. The slope of the yield curve is an important economic gauge, as an inverted yield curve has presaged every recession since the 1970s (though not all inverted yield curves have been followed shortly by recessions). The Fed’s ability to substantially raise interest rates before yield curve inversion has been trending lower over the last few decades. Because the 10-year Treasury yield has been in a secular decline since the mid-80s, the Fed’s ability to raise short-term has been constrained. That said, we’re likely to hear more in the coming months about yield curve inversion and, thus, increased recessionary risks. And while it’s true that the Fed has never started a rate hiking campaign when the yield curve has been this flat (as seen in Figure 2 as measured by the difference in yields between 10-year and 2-year U.S. Treasury), the more important tenors on the yield curve, at least in terms of presaging recessions, are the three-month and 10-year yields, which are still far from inversion. As such, we believe the Fed has room to raise interest rates before true inversion takes place.
Help Wanted?
As if the Fed’s job wasn’t challenging enough in the current environment, it will be meeting this week with candidates for three vacant Governor seats. Congress has yet to confirm the five Fed nominations, including Chair Pro Tempore Jerome Powell and Vice Chair Lael Brainard. Powell and Brainard will still be able to vote (while their respective terms have ended, they are able to stay on the Board until the positions are replaced) and the exclusion of three regular voting members shouldn’t be disruptive. Nonetheless, three fewer voters (and thus fewer opinions on the Committee) likely couldn’t come at a worse time as the Fed is dealing with stubbornly elevated consumer price pressures.
Conclusion
The job of a central banker is never an easy one but given all the uncertainty in the world, their jobs have become much more challenging. The situation in Eastern Europe is certainly adding to the uncertain inflation dynamics and global growth prospects, but one of the main mandates of the Federal Reserve is also price stability. As such, we think the Fed is going to have to scale back monetary accommodation to try and arrest stubbornly high price pressures. We expect the Fed will kick off a series of interest rate hikes this week with a 25 basis point increase in the fed funds rate. But the path of policy normalization will be “data dependent” and much more measured than the pace of inflation would suggest. Lawrence Gillum, CFA, Fixed Income Strategist, LPL Financial Ryan Detrick, CMT, Chief Market Strategist, LPL Financial ______________________________________________________________________________________________ IMPORTANT DISCLOSURES This material is for general information only and is not intended to provide specific advice or recommendations for any individual. There is no assurance that the views or strategies discussed are suitable for all investors or will yield positive outcomes. Investing involves risks including possible loss of principal. Any economic forecasts set forth may not develop as predicted and are subject to change. References to markets, asset classes, and sectors are generally regarding the corresponding market index. Indexes are unmanaged statistical composites and cannot be invested into directly. Index performance is not indicative of the performance of any investment and do not reflect fees, expenses, or sales charges. All performance referenced is historical and is no guarantee of future results. Any company names noted herein are for educational purposes only and not an indication of trading intent or a solicitation of their products or services. LPL Financial doesn’t provide research on individual equities. All information is believed to be from reliable sources; however, LPL Financial makes no representation as to its completeness or accuracy. US Treasuries may be considered “safe haven” investments but do carry some degree of risk including interest rate, credit, and market risk. Bonds are subject to market and interest rate risk if sold prior to maturity. Bond values will decline as interest rates rise and bonds are subject to availability and change in price. The Standard & Poor’s 500 Index (S&P500) is a capitalization-weighted index of 500 stocks designed to measure performance of the broad domestic economy through changes in the aggregate market value of 500 stocks representing all major industries. The PE ratio (price-to-earnings ratio) is a measure of the price paid for a share relative to the annual net income or profit earned by the firm per share. It is a financial ratio used for valuation: a higher PE ratio means that investors are paying more for each unit of net income, so the stock is more expensive compared to one with lower PE ratio. Earnings per share (EPS) is the portion of a company’s profit allocated to each outstanding share of common stock. EPS serves as an indicator of a company’s profitability. Earnings per share is generally considered to be the single most important variable in determining a share’s price. It is also a major component used to calculate the price-to-earnings valuation ratio. All index data from FactSet. This research material has been prepared by LPL Financial LLC. Securities and advisory services offered through LPL Financial (LPL), a registered investment advisor and broker-dealer (member FINRA/SIPC). Insurance products are offered through LPL or its licensed affiliates. To the extent you are receiving investment advice from a separately registered independent investment advisor that is not an LPL affiliate, please note LPL makes no representation with respect to such entity. Not Insured by FDIC/NCUA or Any Other Government Agency | Not Bank/Credit Union Guaranteed | Not Bank/Credit Union Deposits or Obligations | May Lose Value
RES-1086450-0322 | For Public Use | Tracking # 1-05255242 (Exp. 3/23)
Not all recessions are created equal. Previous downturns in the U.S. were prompted by various shocks, with the most recent recession started by health and government-induced shutdowns. Other recessions started in the corporate sector, whereas some started from commodity shocks. The next one could start from geopolitical tensions. Nonetheless, we think the current business and consumer environments are safe from near-term recession risks.
Not all recessions are created equal
Recessions are sometimes difficult to describe, let alone predict. Definitions vary widely. To make matters worse, some coin their mixed forecasts as a “growth recession.”1 Some simply describe a recession as two consecutive quarters of negative economic growth, which is clearly not true because the 2001 recession was shorter: growth in the first quarter of 2001 declined by 1.3% annualized but between strong quarters both grew above 2%. The National Bureau of Economic Research (NBER) is the official arbiter of recessions and their definition is not much better. “A recession is a significant decline in economic activity spread across the economy and that lasts more than a few months.”2 The NBER specifically looks at economic indicators such as production and employment. Because the definitions can be elusive and ambiguous, we think it behooves investors to focus on the overall trajectory and economic environment for both businesses and households.
This time is different, or is it?
As we emphasize above, each recession has different causes and different impacts, but one thing that is not different is the required analysis. Whatever the circumstance, investors should look at multiple signals, not just the infamous and often misused inverted yield curve indicator. Our base case is the domestic economy will weather through this current storm of elevated prices, geopolitical risks, and clogged supply chains. Serious risks remain, but we think business and consumer metrics support our base case thesis that the U.S. will not fall into recession this year.
Consumers are much less levered this time around
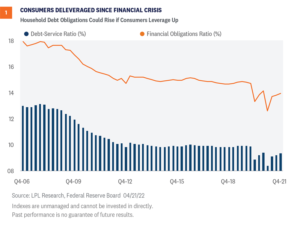
After the Great Financial Crisis, consumers started deleveraging. Both the Debt Service Ratio and the broader Financial Obligations Ratio gradually declined and remained steady until the emergence of COVID-19. Government pandemic assistance programs including stimulus and forbearance periods added volatility to consumers’ financial obligations, but if consumers are able to keep relatively low debt levels, we think the consumer can successfully navigate a period of rising borrowing costs without squelching spending.
Checkable deposits are at historic levels
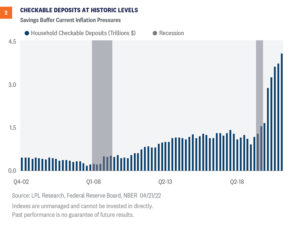
High savings will help consumers navigate the current inflationary period. Given the uncertainty of the pandemic and generous stimulus measures, deposits grew to roughly $3 trillion above normal levels.3 During the crisis when the Federal Reserve (Fed) aggressively cut rates and individuals were highly risk averse, the cost of holding checkable deposits was low so individuals tended to increase savings, thereby adding to bank deposits. Aggregate savings were also bolstered by higher income households who normally spend a larger percentage of discretionary income on services – like travel experiences – but were shut down during the pandemic. Accumulated savings provide a cushion for some consumers during this period of high prices and economic uncertainty.
Labor market gives power to the people
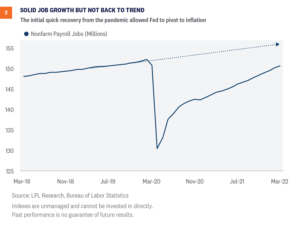
Employment rebounded from the lows of April 2020 but soon after the beginning of 2021, the rate of job creation slowed. The tight labor market is ripe for the 1.5 million former workers to return on their own terms. Such a high inflationary environment could convince some of these “lost” workers to return. As long as the economy is approaching full employment, the Fed will focus on the mandate for price stability. Our base case scenario includes a cooling of both inflation and the job market, which may allow the Fed to pause rate hikes toward the end of the year, limiting risks of over tightening. In many previous cycles, the Fed was accused of overtightening and pushing the economy into a hard landing, which is the scenario where unemployment rises and economic growth contracts.
Firms are taking advantage of pricing power
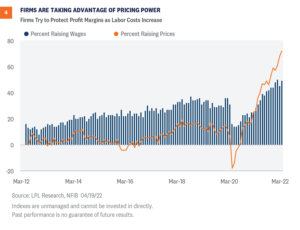
Consumers are likely in a safe space for the current environment, but what about businesses? The National Federation of Independent Business (NFIB) reports that small businesses are adjusting to a variety of current headwinds such as a tight labor market with high quit rates and clogged supply chains pushing up raw material costs. As of March, roughly 50% of small businesses in the U.S. raised compensation to attract and retain workers according to the NFIB. In the same month, over 70% of firms raised prices to cover increased costs. Firms with the ability to pass along cost increases will be able to protect profit margins as labor and material costs increase.
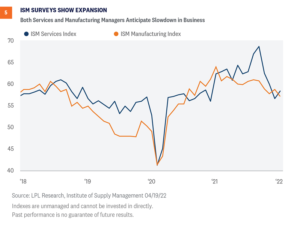
Purchasing manager surveys show expansion
Managers in both services and manufacturing anticipate a slowdown in business, yet still expect growth in spite of the headwinds from commodity markets and tight labor markets. In fact, both indexes are above 55 – values above 50 indicate expansion. If firms are able to recalibrate running their business, we expect a rebound in growth the latter half of this year even though the first half might be sluggish.
Conclusion
Not all recessions are the same. Risks remain: the Fed could lose sight of its dual mandate or supply chains remain clogged from Eastern European wars and Asian lockdowns. Inflation could not cool as consumers pivot back from goods-centric spending (cars and washing machines) to services spending (hotels and airplane tickets). In spite of these risks, the metrics above suggest that the economy could escape a recession in the near term, with potential for nearly 3% growth this year. On balance, we think the economy is steady enough to handle the current tightening cycle even if the Fed is coming late with its hawkish tones. 1 https://www2.deloitte.com/us/en/insights/economy/us-economic-forecast/united-states-outlook-analysis.html 2 https://www.nber.org/research/business-cycle-dating/business-cycle-dating-procedure-frequently-asked-questions 3 https://www.occ.treas.gov/publications-and-resources/publications/economics/on-point/pub-on-point-deposit-growth-slowing-low-cost-funding-endure.pdf Jeffrey Roach, PhD, Chief Economist, LPL Financial Lawrence Gillum, CFA, Fixed Income Strategist, LPL Financial ______________________________________________________________________________________________ IMPORTANT DISCLOSURES This material is for general information only and is not intended to provide specific advice or recommendations for any individual. There is no assurance that the views or strategies discussed are suitable for all investors or will yield positive outcomes. Investing involves risks including possible loss of principal. Any economic forecasts set forth may not develop as predicted and are subject to change. References to markets, asset classes, and sectors are generally regarding the corresponding market index. Indexes are unmanaged statistical composites and cannot be invested into directly. Index performance is not indicative of the performance of any investment and does not reflect fees, expenses, or sales charges. All performance referenced is historical and is no guarantee of future results. Any company names noted herein are for educational purposes only and not an indication of trading intent or a solicitation of their products or services. LPL Financial doesn’t provide research on individual equities. All information is believed to be from reliable sources; however, LPL Financial makes no representation as to its completeness or accuracy. The U.S. Institute for Supply Managers (ISM) manufacturing index is an economic indicator derived from monthly surveys of private sector companies, and is intended to show the economic health of the U.S. manufacturing sector. A PMI of more than 50 indicates expansion in the manufacturing sector, a reading below 50 indicates contraction, and a reading of 50 indicates no change. ISM Non-Manufacturing PMI (Services) is based on surveys of more than 400 non-manufacturing firms’ purchasing and supply executives. All index data from FactSet. This research material has been prepared by LPL Financial LLC. Securities and advisory services offered through LPL Financial (LPL), a registered investment advisor and broker-dealer (member FINRA/SIPC). Insurance products are offered through LPL or its licensed affiliates. To the extent you are receiving investment advice from a separately registered independent investment advisor that is not an LPL affiliate, please note LPL makes no representation with respect to such entity. Not Insured by FDIC/NCUA or Any Other Government Agency | Not Bank/Credit Union Guaranteed | Not Bank/Credit Union Deposits or Obligations | May Lose Value
RES-1131618-0422 | For Public Use | Tracking # 1-05271721 (Exp. 4/23)
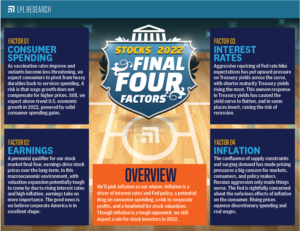
As the Final Four NCAA Basketball Tournament rolls on in New Orleans, we continue our tradition of picking a stock market final four. We have identified our four key factors for the stock market outlook: 1) Consumer spending, 2) Earnings, 3) Interest rates, and 4) Inflation. We also celebrate last year’s winner: COVID-19 vaccines. Below we discuss these four factors, how they may influence markets this year, and pick our winner. Good luck to Kansas and North Carolina in tonight’s final.
Factor #1: Consumer Spending
Consumer spending dynamics will likely play a key role for investors this year. Going into 2022, consumers were focusing on satiating their appetite for durable goods. Given pandemic-related precautions, consumers focused on e-commerce opportunities to order up large-ticket items such as furniture and recreational equipment and small items such as food and daily personal toiletries. As vaccination rates improve (see last year’s Final Four commentary) and variants become less threatening, we expect consumers to pivot from heavy durables back to services spending. In developed economies, services make up an outsized portion of total consumer spending. Even though some services spending has recovered since the onset of the pandemic, we have much more to go. A risk is that wage growth does not compensate for higher prices, but consumer finances are in good shape overall, with household checkable deposits the highest since the Federal Reserve Board started recording the data. We continue to expect above-trend U.S. economic growth in 2022, powered by solid consumer spending gains.
Factor #2: Earnings
A perennial qualifier for our stock market final four, over the long-term, earnings drive stock prices. In this environment, with valuation expansion potentially tough to come by due to rising interest rates and high inflation, earnings take on more importance. The good news is we believe Corporate America is in excellent shape—earnings estimates are higher in 2022 now than they were at the start of the year, which is no small feat. And high inflation has brought pricing power to many companies along with more revenue for commodity producers. This is evident in the double-digit revenue growth S&P 500 companies are expected to produce in first quarter 2022 earnings season (source: FactSet). Despite margin pressures related to supply chain disruptions and intense inflation pressures, we believe S&P 500 companies may deliver as much as 10% earnings per share (EPS) growth in the first quarter, compared to the current consensus estimate of about 5%. For 2022, we believe S&P 500 earnings are on track to potentially grow mid-to-high single digits. The roughly 2% year-to-date increase in the consensus S&P 500 EPS estimate for 2022 is an encouraging sign.
Factor #3: Interest Rates (and the federal reserve)
U.S. Treasury yields have moved meaningfully higher this year due to the increase in Federal Reserve (Fed) interest rate hike expectations. To start the year, bond markets were expecting two or three rate hikes in 2022, but due to broadening inflationary pressures, markets now expect the Fed to hike interest rates eight more times and bring the fed funds rate to nearly 2.5% by yearend. If the Fed does meet market expectations, it would be the most aggressive start to a rate hiking campaign since 1993/94. This aggressive repricing, however, has put upward pressure on Treasury yields across the curve, with shorter maturity Treasury yields rising the most. This uneven response in Treasury yields has caused the yield curve to flatten and, in some places, invert (yields on shorter maturity securities exceeding longer maturity yields). Yield curve inversion is often looked at as a reliable predictor of recessions. However, the more important maturities on the yield curve, at least in terms of presaging recessions, are the three-month and 10-year yields, which are still far from inversion. Rates are important not only because of their usefulness as an economic signal and as a driver of bond returns, but also because of their influence on stock valuations, as we wrote about here last week.
Factor #4: Inflation
The favorite heading into our tournament, inflation impacts will be top of mind throughout the year. The confluence of supply constraints and surging demand has made pricing pressures a big concern for markets, consumers, and policy makers. Russian aggression only made things worse as commodity markets tightened amid global sanctions against one of the largest exporters of natural gas, wheat, and precious metals. The tight labor market could play a factor in the persistence of inflation, as wages will likely rise as firms try to attract available workers off the sidelines. One corresponding risk in this historic environment is a potentially overly aggressive Fed. There are silver linings. For some, this year may hold a unique place in their life as some lucky car owners have sold their used car for more than they paid. Who has ever heard of a vehicle as an appreciated asset? Inflation and low interest rates have also been a boon to borrowers, with the real value of loans falling due to inflation while interest rates remain historically low. (And it’s not lost on us that the biggest borrower of all, the U.S. government, may be the biggest beneficiary.) Firms with pricing power can cope with rising input costs by passing on the cost to consumers without material impact on market share. The Fed is rightfully concerned about the nefarious effects of inflation on the consumer. Rising prices put a squeeze on discretionary spending and real wages. We are hopeful, but not optimistic, that the Fed’s forecast of 4.1% inflation at yearend will be reached.
Conclusion
This year’s winner wasn’t as easy to call as last year, when the vaccines won in a rout. We’re picking inflation as our winner because it’s tied so closely to the other key factors. Inflation is a driver of interest rates and Fed policy, a potential drag on consumer spending, a risk to corporate profits, and a headwind for stock valuations. Inflation is also difficult to predict due to the geopolitical uncertainty in Europe and the complexity of ongoing COVID-19 effects on supply chains and labor participation. When we put all of these factors together, our expectation that inflation pressures will soon start to abate, reducing the likelihood of an overly aggressive Fed, leads us to maintain our positive stock market view. We continue to recommend a modest overweight allocation to equities and an underweight to fixed income allocation relative to investors’ targets, as appropriate. However, we recognize that stocks are likely to garner less valuation support at higher interest rate levels, suggesting a slightly more cautious stance may be appropriate at this time. Our year-end 2022 fair value target for the S&P 500 is 4,800 – 4,900. Jeff Buchbinder, CFA, Equity Strategist, LPL Financial Jeffrey Roach, PhD, Chief Economist, LPL Financial Lawrence Gillum, CFA, Fixed Income Strategist, LPL Financial ______________________________________________________________________________________________ IMPORTANT DISCLOSURES This material is for general information only and is not intended to provide specific advice or recommendations for any individual. There is no assurance that the views or strategies discussed are suitable for all investors or will yield positive outcomes. Investing involves risks including possible loss of principal. Any economic forecasts set forth may not develop as predicted and are subject to change. References to markets, asset classes, and sectors are generally regarding the corresponding market index. Indexes are unmanaged statistical composites and cannot be invested into directly. Index performance is not indicative of the performance of any investment and does not reflect fees, expenses, or sales charges. All performance referenced is historical and is no guarantee of future results. Any company names noted herein are for educational purposes only and not an indication of trading intent or a solicitation of their products or services. LPL Financial doesn’t provide research on individual equities. All information is believed to be from reliable sources; however, LPL Financial makes no representation as to its completeness or accuracy. U.S. Treasuries may be considered “safe haven” investments but do carry some degree of risk including interest rate, credit, and market risk. Bonds are subject to market and interest rate risk if sold prior to maturity. Bond values will decline as interest rates rise and bonds are subject to availability and change in price. The Standard & Poor’s 500 Index (S&P500) is a capitalization-weighted index of 500 stocks designed to measure performance of the broad domestic economy through changes in the aggregate market value of 500 stocks representing all major industries. The PE ratio (price-to-earnings ratio) is a measure of the price paid for a share relative to the annual net income or profit earned by the firm per share. It is a financial ratio used for valuation: a higher PE ratio means that investors are paying more for each unit of net income, so the stock is more expensive compared to one with lower PE ratio. Earnings per share (EPS) is the portion of a company’s profit allocated to each outstanding share of common stock. EPS serves as an indicator of a company’s profitability. Earnings per share is generally considered to be the single most important variable in determining a share’s price. It is also a major component used to calculate the price-to-earnings valuation ratio. All index data from FactSet. This research material has been prepared by LPL Financial LLC. Securities and advisory services offered through LPL Financial (LPL), a registered investment advisor and broker-dealer (member FINRA/SIPC). Insurance products are offered through LPL or its licensed affiliates. To the extent you are receiving investment advice from a separately registered independent investment advisor that is not an LPL affiliate, please note LPL makes no representation with respect to such entity. Not Insured by FDIC/NCUA or Any Other Government Agency | Not Bank/Credit Union Guaranteed | Not Bank/Credit Union Deposits or Obligations | May Lose Value
RES-1113200-0322 | For Public Use | Tracking # 1-05263387 (Exp. 4/23)
We currently expect the U.S. economy to grow 3.7% in 2022. The risks are to the downside since the Fed may err on tightening too fast, the recent commodity spike may trickle down to the U.S. consumer, and supply and demand imbalances may last longer than expected. This forecast is lowered from our previous 4-4.5% range originally published in Outlook 2022: Passing the Baton. The rest of this commentary explains the overall themes supporting the forecast.
From One Risk to Another
The U.S. economy grew 5.7% in 2021, exhibiting strength after an unprecedented global pandemic, but as the economy marched into 2022, the COVID-19 Omicron variant squelched some of the rebound in economic activity. Most saw this headwind to be temporary and mostly affecting the first quarter estimates. The LPL growth forecast for 2022 was initially developed in November 2021, and so the reality of a new COVID-19 variant stage was yet to emerge. As the data came out, we saw the need to revise down our forecast for the year. We currently expect the U.S. economy to grow 3.7% in 2022 with risks to the downside for multiple reasons. The rest of this commentary explains the overall themes supporting the forecast. We end this note with risks and alternative scenarios.
From Shuttered to Unshuttered
Vaccination rates, COVID-19 cases, and hospitalizations have all improved in recent months and the data proves it. Google mobility trends for everything from theme parks to movie theaters are higher now than last year. Even though remote work seems to be available for many white-collar jobs, Google mobility trends for places of work is also up since December. These stats bode well for consumer spending and business investment, two key components to economic growth and corporate profits. The speed at which federal, state, and local governments shuttered the economy gave rise to an unprecedented shift away from services spending and into goods spending. Now, the debate is centered on how fast this compositional shift will revert to more normal ratios.
Purchasing a New Washing Machine Happens Only So Many Times
At the height of the pandemic shutdowns, consumers spent discretionary funds on bikes, boats, beds, or books. Few spent on cruises and casinos. Even if people wanted those services, governmental authorities closed those doors. An unintended consequence of this massive shift in demand from services to goods created immense pressure on suppliers to get products to the market in a timely fashion. The toilet paper and N95 mask shortages of 2020 illustrate fundamental laws of economics. If prices and supply are fixed in the short run and consumer demand spikes, the market will experience shortages. In a freely functioning economy, the simple way to fix a shortage is for suppliers to raise prices and post COVID-19, these fundamental laws still hold true. Much of the lingering inflationary pressures come from these supply and demand imbalances. However, demand for durable goods will likely normalize soon. Most people do not buy a new washing machine on a regular or even semi-regular basis. Outside of the ratio of goods to services spending, suppliers are also dealing with demand that may be sustained longer than anticipated. For example, a new study by Global Industry Analysts report that the N95 mask market will reach $11.8 billion in a few years.1 For our forecast, we expect consumer goods spending to contribute to growth in 2022 but not at the same rate as 2021 (Figure 1). In previous years, consumer goods spending contributed less than 1% to overall GDP, and if domestic consumers normalize spending habits this year, we will have downside risk to our 2022 growth estimate. Consumers pulled forward demand, so goods consumption added an outsized amount to headline growth.
A Rebound in Services Spending Could Support Growth in Q3 and Q4
The base case for the forecast rests on a recovery in services spending as the year progresses. Real spending on goods will normalize as consumers pulled forward demand in recent quarters and as consumers had stimulus funds to spend while sheltered at home. Still, services spending is below trend (Figure 2).
Risks to the Forecast
Our baseline forecast expects the Federal Reserve to move at a measured pace and not likely “shock and awe” the markets with unexpected large rate hikes. We also expect that as demand and supply imbalances normalize, consumers will expect easing pricing pressures. Ripple effects from the Russian invasion of Ukraine will be mostly in Europe and will be minimal in the U.S. Russia only accounts for roughly 1% of U.S. goods imports (Figure 3). Our forecast does have risks to the downside as commodity prices have spiked and we do not know how OPEC+ and other systemically important entities will respond. 1 https://finance.yahoo.com/news/global-n95-masks-market-reach-162500512.html?guccounter=1&guce_referrer=aHR0cHM6Ly93d3cuZ29vZ2xlLmNvbS8&guce_referrer_sig=AQAAALc_1e4fyvnrereNnwWfvM3sCJzrFsFJDBtV4k3Ub9IrJBGtdjhRhb0_qf4hVVtz89WKpZfxZqpPeuwwbyHgK7eAewj7bENcPgkOT3n5NJU6psgyVuMj7ra2ER0GjwTNU0uP3BTfsLINfy2j7oz2mDgNdu3LuFQ9PGjT218l5qVs Jeffrey Roach, PhD, Chief Economist, LPL Financial ______________________________________________________________________________________________ IMPORTANT DISCLOSURES This material is for general information only and is not intended to provide specific advice or recommendations for any individual. There is no assurance that the views or strategies discussed are suitable for all investors or will yield positive outcomes. Investing involves risks including possible loss of principal. Any economic forecasts set forth may not develop as predicted and are subject to change. References to markets, asset classes, and sectors are generally regarding the corresponding market index. Indexes are unmanaged statistical composites and cannot be invested into directly. Index performance is not indicative of the performance of any investment and does not reflect fees, expenses, or sales charges. All performance referenced is historical and is no guarantee of future results. Any company names noted herein are for educational purposes only and not an indication of trading intent or a solicitation of their products or services. LPL Financial doesn’t provide research on individual equities. All information is believed to be from reliable sources; however, LPL Financial makes no representation as to its completeness or accuracy. U.S. Treasuries may be considered “safe haven” investments but do carry some degree of risk including interest rate, credit, and market risk. Bonds are subject to market and interest rate risk if sold prior to maturity. Bond values will decline as interest rates rise and bonds are subject to availability and change in price. The Standard & Poor’s 500 Index (S&P500) is a capitalization-weighted index of 500 stocks designed to measure performance of the broad domestic economy through changes in the aggregate market value of 500 stocks representing all major industries. The PE ratio (price-to-earnings ratio) is a measure of the price paid for a share relative to the annual net income or profit earned by the firm per share. It is a financial ratio used for valuation: a higher PE ratio means that investors are paying more for each unit of net income, so the stock is more expensive compared to one with lower PE ratio. Earnings per share (EPS) is the portion of a company’s profit allocated to each outstanding share of common stock. EPS serves as an indicator of a company’s profitability. Earnings per share is generally considered to be the single most important variable in determining a share’s price. It is also a major component used to calculate the price-to-earnings valuation ratio. All index data from FactSet. This research material has been prepared by LPL Financial LLC. Securities and advisory services offered through LPL Financial (LPL), a registered investment advisor and broker-dealer (member FINRA/SIPC). Insurance products are offered through LPL or its licensed affiliates. To the extent you are receiving investment advice from a separately registered independent investment advisor that is not an LPL affiliate, please note LPL makes no representation with respect to such entity. Not Insured by FDIC/NCUA or Any Other Government Agency | Not Bank/Credit Union Guaranteed | Not Bank/Credit Union Deposits or Obligations | May Lose Value
RES-1074500-0322 | For Public Use | Tracking # 1-05252116 (Exp. 3/23)
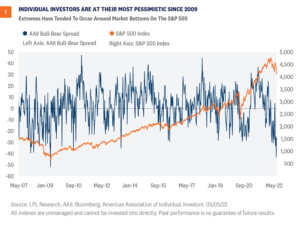
 1) AAII Investor Sentiment Survey. The individual investors surveyed weekly by the American Association of Individual Investors (AAII) have displayed extreme levels of pessimism in recent weeks. The readings in April included the lowest number of bullish investors in almost 30 years (15.8% on April 14) and the highest number of bearish investors since 2009 (59.4% on April 28). As shown in Figure 1, the spread between the number of investors who are bullish and those who are bearish has recently reached extreme levels not seen since 2009.
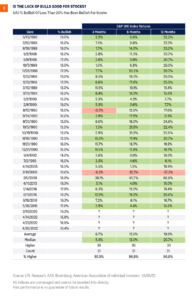
 In April the number of investors who said they were bullish was under 20% for three weeks in a row, which is only the second time this has occurred (the first was in 1988). When bulls have dropped below 20%, it’s tended to be a strong contrarian indicator of above average short-term returns ahead. As shown in Figure 2, when the number of bullish investors has fallen below 20% the forward three-month returns have been negative only twice and the forward six and 12-month returns negative only once (during the Great Financial Crisis of 2008-09). 2) Investors Intelligence Advisors Sentiment Report. This sentiment report surveys over 100 independent investment newsletters and reports the percentage of advisors that are bullish, bearish, and those that expect a correction. The ratio of bulls to bears dropped to 0.79 on May 3. Levels under 1 have typically been seen only toward the end of bear markets or corrections. 3) Barron’s Big Money Poll. This poll is taken twice a year, with the most recent poll closing in April and drawing 112 responses from professional money managers. When asked about their clients’ outlook for stocks, 24% said they were bearish, which was twice as many as the 12% who said their clients were bullish. Interestingly, when those same money managers were asked if they had been net buyers, net sellers, or had made no change to their U.S. equity allocation this year, only 21% were net sellers, which leads us to our next point.
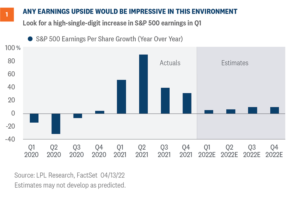

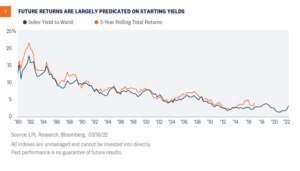
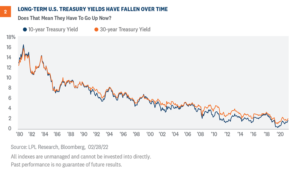

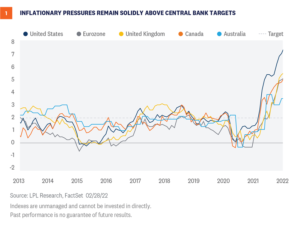
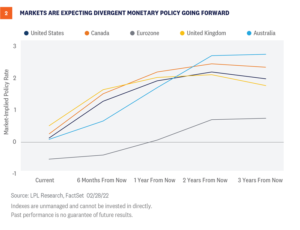 Our view remains that interest rate hikes for the U.S. will likely begin in March with a 25 basis point (0.25%) hike and then three to four more rate hikes at subsequent meetings in 2022. Moreover, we think the Fed will start to reduce its nearly $9 trillion balance sheet in the second half of 2022. There is a risk to the upside (in hikes) depending on the trajectory of inflationary pressures. If consumer price pressures moderate over the course of the year, as we and the Fed expect, then we think the Fed and other central bankers can take a more moderate approach to interest rate hikes. However, if inflationary pressures remain stubbornly high and, importantly, we start to see longer-term inflation expectations become unanchored, central bankers may be forced to move more aggressively than what is already priced in. That said, given the current conflict in the Ukraine, there remains considerable near term uncertainty with central bank intentions. Additionally, upward pressure on commodity prices, already impacted by COVID-19-related supply chain disruptions, may see a more sustained impact as economic sanctions play out and will probably be the main source of risk for possible broader economic repercussions. As such, inflationary pressures may remain high particularly as it relates to gas prices. Finally, and we can’t stress this enough, these views and opinions are secondary to the conflict taking place in Ukraine. While our primary job is to provide investment advice, we certainly recognize that there is an immediate humanitarian crisis taking place in eastern Europe. We hope the conflict ends quickly and offer our thoughts to those impacted. Lawrence Gillum, CFA, Fixed Income Strategist, LPL Financial Ryan Detrick, CMT, Chief Market Strategist, LPL Financial ______________________________________________________________________________________________ IMPORTANT DISCLOSURES This material is for general information only and is not intended to provide specific advice or recommendations for any individual. There is no assurance that the views or strategies discussed are suitable for all investors or will yield positive outcomes. Investing involves risks including possible loss of principal. Any economic forecasts set forth may not develop as predicted and are subject to change. References to markets, asset classes, and sectors are generally regarding the corresponding market index. Indexes are unmanaged statistical composites and cannot be invested into directly. Index performance is not indicative of the performance of any investment and do not reflect fees, expenses, or sales charges. All performance referenced is historical and is no guarantee of future results. Any company names noted herein are for educational purposes only and not an indication of trading intent or a solicitation of their products or services. LPL Financial doesn’t provide research on individual equities. All information is believed to be from reliable sources; however, LPL Financial makes no representation as to its completeness or accuracy. US Treasuries may be considered “safe haven” investments but do carry some degree of risk including interest rate, credit, and market risk. Bonds are subject to market and interest rate risk if sold prior to maturity. Bond values will decline as interest rates rise and bonds are subject to availability and change in price. The Standard & Poor’s 500 Index (S&P500) is a capitalization-weighted index of 500 stocks designed to measure performance of the broad domestic economy through changes in the aggregate market value of 500 stocks representing all major industries. The PE ratio (price-to-earnings ratio) is a measure of the price paid for a share relative to the annual net income or profit earned by the firm per share. It is a financial ratio used for valuation: a higher PE ratio means that investors are paying more for each unit of net income, so the stock is more expensive compared to one with lower PE ratio. Earnings per share (EPS) is the portion of a company’s profit allocated to each outstanding share of common stock. EPS serves as an indicator of a company’s profitability. Earnings per share is generally considered to be the single most important variable in determining a share’s price. It is also a major component used to calculate the price-to-earnings valuation ratio. All index data from FactSet. This research material has been prepared by LPL Financial LLC. Securities and advisory services offered through LPL Financial (LPL), a registered investment advisor and broker-dealer (member FINRA/SIPC). Insurance products are offered through LPL or its licensed affiliates. To the extent you are receiving investment advice from a separately registered independent investment advisor that is not an LPL affiliate, please note LPL makes no representation with respect to such entity. Not Insured by FDIC/NCUA or Any Other Government Agency | Not Bank/Credit Union Guaranteed | Not Bank/Credit Union Deposits or Obligations | May Lose Value
RES-1066650-0222 | For Public Use | Tracking # 1-05248727 (Exp. 2/23)
Our view remains that interest rate hikes for the U.S. will likely begin in March with a 25 basis point (0.25%) hike and then three to four more rate hikes at subsequent meetings in 2022. Moreover, we think the Fed will start to reduce its nearly $9 trillion balance sheet in the second half of 2022. There is a risk to the upside (in hikes) depending on the trajectory of inflationary pressures. If consumer price pressures moderate over the course of the year, as we and the Fed expect, then we think the Fed and other central bankers can take a more moderate approach to interest rate hikes. However, if inflationary pressures remain stubbornly high and, importantly, we start to see longer-term inflation expectations become unanchored, central bankers may be forced to move more aggressively than what is already priced in. That said, given the current conflict in the Ukraine, there remains considerable near term uncertainty with central bank intentions. Additionally, upward pressure on commodity prices, already impacted by COVID-19-related supply chain disruptions, may see a more sustained impact as economic sanctions play out and will probably be the main source of risk for possible broader economic repercussions. As such, inflationary pressures may remain high particularly as it relates to gas prices. Finally, and we can’t stress this enough, these views and opinions are secondary to the conflict taking place in Ukraine. While our primary job is to provide investment advice, we certainly recognize that there is an immediate humanitarian crisis taking place in eastern Europe. We hope the conflict ends quickly and offer our thoughts to those impacted. Lawrence Gillum, CFA, Fixed Income Strategist, LPL Financial Ryan Detrick, CMT, Chief Market Strategist, LPL Financial ______________________________________________________________________________________________ IMPORTANT DISCLOSURES This material is for general information only and is not intended to provide specific advice or recommendations for any individual. There is no assurance that the views or strategies discussed are suitable for all investors or will yield positive outcomes. Investing involves risks including possible loss of principal. Any economic forecasts set forth may not develop as predicted and are subject to change. References to markets, asset classes, and sectors are generally regarding the corresponding market index. Indexes are unmanaged statistical composites and cannot be invested into directly. Index performance is not indicative of the performance of any investment and do not reflect fees, expenses, or sales charges. All performance referenced is historical and is no guarantee of future results. Any company names noted herein are for educational purposes only and not an indication of trading intent or a solicitation of their products or services. LPL Financial doesn’t provide research on individual equities. All information is believed to be from reliable sources; however, LPL Financial makes no representation as to its completeness or accuracy. US Treasuries may be considered “safe haven” investments but do carry some degree of risk including interest rate, credit, and market risk. Bonds are subject to market and interest rate risk if sold prior to maturity. Bond values will decline as interest rates rise and bonds are subject to availability and change in price. The Standard & Poor’s 500 Index (S&P500) is a capitalization-weighted index of 500 stocks designed to measure performance of the broad domestic economy through changes in the aggregate market value of 500 stocks representing all major industries. The PE ratio (price-to-earnings ratio) is a measure of the price paid for a share relative to the annual net income or profit earned by the firm per share. It is a financial ratio used for valuation: a higher PE ratio means that investors are paying more for each unit of net income, so the stock is more expensive compared to one with lower PE ratio. Earnings per share (EPS) is the portion of a company’s profit allocated to each outstanding share of common stock. EPS serves as an indicator of a company’s profitability. Earnings per share is generally considered to be the single most important variable in determining a share’s price. It is also a major component used to calculate the price-to-earnings valuation ratio. All index data from FactSet. This research material has been prepared by LPL Financial LLC. Securities and advisory services offered through LPL Financial (LPL), a registered investment advisor and broker-dealer (member FINRA/SIPC). Insurance products are offered through LPL or its licensed affiliates. To the extent you are receiving investment advice from a separately registered independent investment advisor that is not an LPL affiliate, please note LPL makes no representation with respect to such entity. Not Insured by FDIC/NCUA or Any Other Government Agency | Not Bank/Credit Union Guaranteed | Not Bank/Credit Union Deposits or Obligations | May Lose Value
RES-1066650-0222 | For Public Use | Tracking # 1-05248727 (Exp. 2/23)