With the fourth quarter underway—historically the best quarter for stocks, by the way—2022 is fast approaching. While a lot can still happen between now and the end of 2021, we don’t think it’s too early to start thinking about what stocks might do next year. We see a favorable economic environment for stocks in 2022, consistent with prior mid-cycle expansion years and bolstered by continued earnings growth. The gains may not come easy, however, with a number of risks such as COVID-19-related supply chain disruptions, inflation, and higher interest rates.
WE START TOP DOWN
As 2021 winds down, we are starting to look ahead to 2022. As a starting point to begin forecasting stock market performance next year, we want to first assess the economic growth outlook and where we are in the economic cycle. If we are approaching the middle of an economic cycle that has at least a few more years to go (our view), then we believe the chances of another good year for stocks in 2022 are fairly high. Mid-cycle simply means we do not believe a recession is likely anytime soon—nor do we expect the big equity gains typically seen when the economy emerges from recession (those came last year). Looking back at the past 50 years, the S&P 500 Index was up an average of 12% during the 27 mid-cycle years we identified, with gains in 81% of those years. We also acknowledge that stocks are up a lot and valuations are elevated (more on that below). The S&P 500 is up 16% year-to-date and 95% since the March 2020 low, which to us means the probability of another big up year in 2022 is relatively low. However, with the economy poised to grow (we expect above-average gross domestic product growth in 2022) the chances of solid gains remain high.
EARNINGS ARE A KEY PIECE OF THE PUZZLE
A growing economy is a great start, but stocks fundamentally derive their value from their earnings stream and earnings start with revenue. The environment for companies to grow revenue next year should be excellent with above-average potential economic growth and some pricing power from elevated inflation. Historically, S&P 500 revenue growth is well correlated to nominal gross domestic product (GDP) growth. Nominal GDP growth is real GDP growth (inflation adjusted) plus inflation. Hypothetically, 4% GDP growth next year (consensus forecast of Bloomberg-surveyed economists) plus perhaps 3% inflation (consensus forecast for the increase in the Consumer Price Index) puts a 7% revenue increase in play. Without any change in profit margins (probably too rosy but let’s keep it simple) and some share repurchases to lower the share counts—a near 10% increase in earnings in 2022 looks to be within the realm of possibility, which is reflected in current consensus estimates shown in Figure 1. Significant earnings momentum is also bullish, with estimates having been raised significantly by analysts over the past six months, also shown in Figure 1. But COVID-19-related supply chain issues and materials and labor shortages may push costs up and pressure corporate profit margins in 2022. Several companies have already warned of such pressures ahead of thirdquarter earnings season (more on that in an upcoming commentary). As a result, we are forecasting S&P 500 earnings growth of 6% in 2022—$218 per share after $205 per share in 2021, shown in Figure 2. However, higher corporate taxes, which we see as likely, may eat into much of those earnings gains in 2022. So, while we anticipate stocks will get some help from earnings in 2022 and expectations for more earnings growth in 2023, uncertainty is clearly high.
EARLY THOUGHTS ON 2022 STOCK MARKET FORECAST
As we think about where stocks might go in 2022, we want to assess where valuations might be in a year and what type of earnings growth markets may be pricing in for 2023 at that time. Looking at valuations first, they are elevated—but strong earnings gains during the ongoing economic recovery and the recent stock market pullback have lowered the price-to-earnings ratio (P/E) for the S&P 500 to about 20.5. Interestingly, the S&P 500 is up 16% year-to-date while the consensus estimate for the index’s EPS in 2021 has risen 20% since January 1, showing that stocks are actually cheaper now than they were at the start of this year. We believe still low interest rates justify current valuation levels, but if rates rise next year as we expect, P/E
multiples are unlikely to rise and may edge lower. That means earnings growth will likely be the primary driver of stock market gains in 2022. Turning to earnings and looking beyond next year, if we assume S&P 500 EPS growth returns to its long-term average in 2023 of about 9% ($218 to roughly $237), while the P/E stays at 20.5, the S&P 500 could be fairly valued at 4,870 at the end of 2022, or 12% above the September 30 close. That seems like a reasonable place to start—though that is not our official forecast—with several percentage points of gains potentially coming in the fourth quarter. The upside to that could come from valuations if interest rates stay lower for longer. The downside
could come from margin pressures, particularly wages, which could chop a few more points off of earnings growth over the next year or two.
CONCLUSION
It’s not too early to start thinking about 2022 as the fourth quarter gets underway. Prospects for above-average economic growth and further earnings gains next year point to another good year for stock investors. We expect interest rates to stay low enough to justify maintaining current valuations, which could set the stage for double digit returns for the S&P 500 next year. Look for more on the earnings outlook in an upcoming commentary previewing third-quarter earnings. And once earnings season gets rolling, we’ll get rolling on writing Outlook 2022. Finally, for those more concerned about finishing up 2021 than what 2022 may have in store, we would not be surprised to see a bit more volatility around China, Covid-19, the Federal Reserve taper, high inflation, supply chain disruptions, and Washington, D.C., headlines. We would look to be buyers on dips given the mostly favorable macroeconomic backdrop, low interest rates, and historically strong fourth-quarter returns. IMPORTANT DISCLOSURES
This material is for general information only and is not intended to provide specific advice or recommendations for any individual. There is no assurance that the views or strategies discussed are suitable for all investors or will yield positive outcomes. Investing involves risks including possible loss of principal. Any economic forecasts set forth may not develop as predicted and are subject to change. References to markets, asset classes, and sectors are generally regarding the corresponding market index. Indexes are unmanaged statistical composites and cannot be invested into directly. Index performance is not indicative of the performance of any investment and do not reflect fees, expenses, or sales charges. All performance referenced is historical and is no guarantee of future results. Any company names noted herein are for educational purposes only and not an indication of trading intent or a solicitation of their products or services. LPL Financial doesn’t provide research on individual equities. All information is believed to be from reliable sources; however, LPL Financial makes no representation as to its completeness or accuracy. U.S. Treasuries may be considered “safe haven” investments but do carry some degree of risk including interest rate, credit, and market risk. Bonds are subject to market and interest rate risk if sold prior to maturity. Bond values will decline as interest rates rise and bonds are subject to availability and change in price. The Standard & Poor’s 500 Index (S&P500) is a capitalization-weighted index of 500 stocks designed to measure performance of the broad domestic economy through changes in the aggregate market value of 500 stocks representing all major industries. The PE ratio (price-to-earnings ratio) is a measure of the price paid for a share relative to the annual net income or profit earned by the firm per share. It is a financial ratio used for valuation: a higher PE ratio means that investors are paying more for each unit of net income, so the stock is more expensive compared to one with lower PE ratio. Earnings per share (EPS) is the portion of a company’s profit allocated to each outstanding share of common stock. EPS serves as an indicator of a company’s profitability. Earnings per share is generally considered to be the single most important variable in determining a share’s price. It is also a major component used to calculate the price-to-earnings valuation ratio. All index data from FactSet. This research material has been prepared by LPL Financial LLC. Securities and advisory services offered through LPL Financial (LPL), a registered investment advisor and broker-dealer (member FINRA/SIPC). Insurance products are offered through LPL or its licensed affiliates. To the extent you are receiving investment advice from a separately registered independent investment advisor that is not an LPL affiliate, please note LPL makes no representation with respect to such entity. Not Insured by FDIC/NCUA or Any Other Government Agency | Not Bank/Credit Union Guaranteed | Not Bank/Credit Union Deposits or Obligations | May Lose Value RES-894867-0921 | For Public Use | Tracking #1-05196942 (Exp. 10/22)
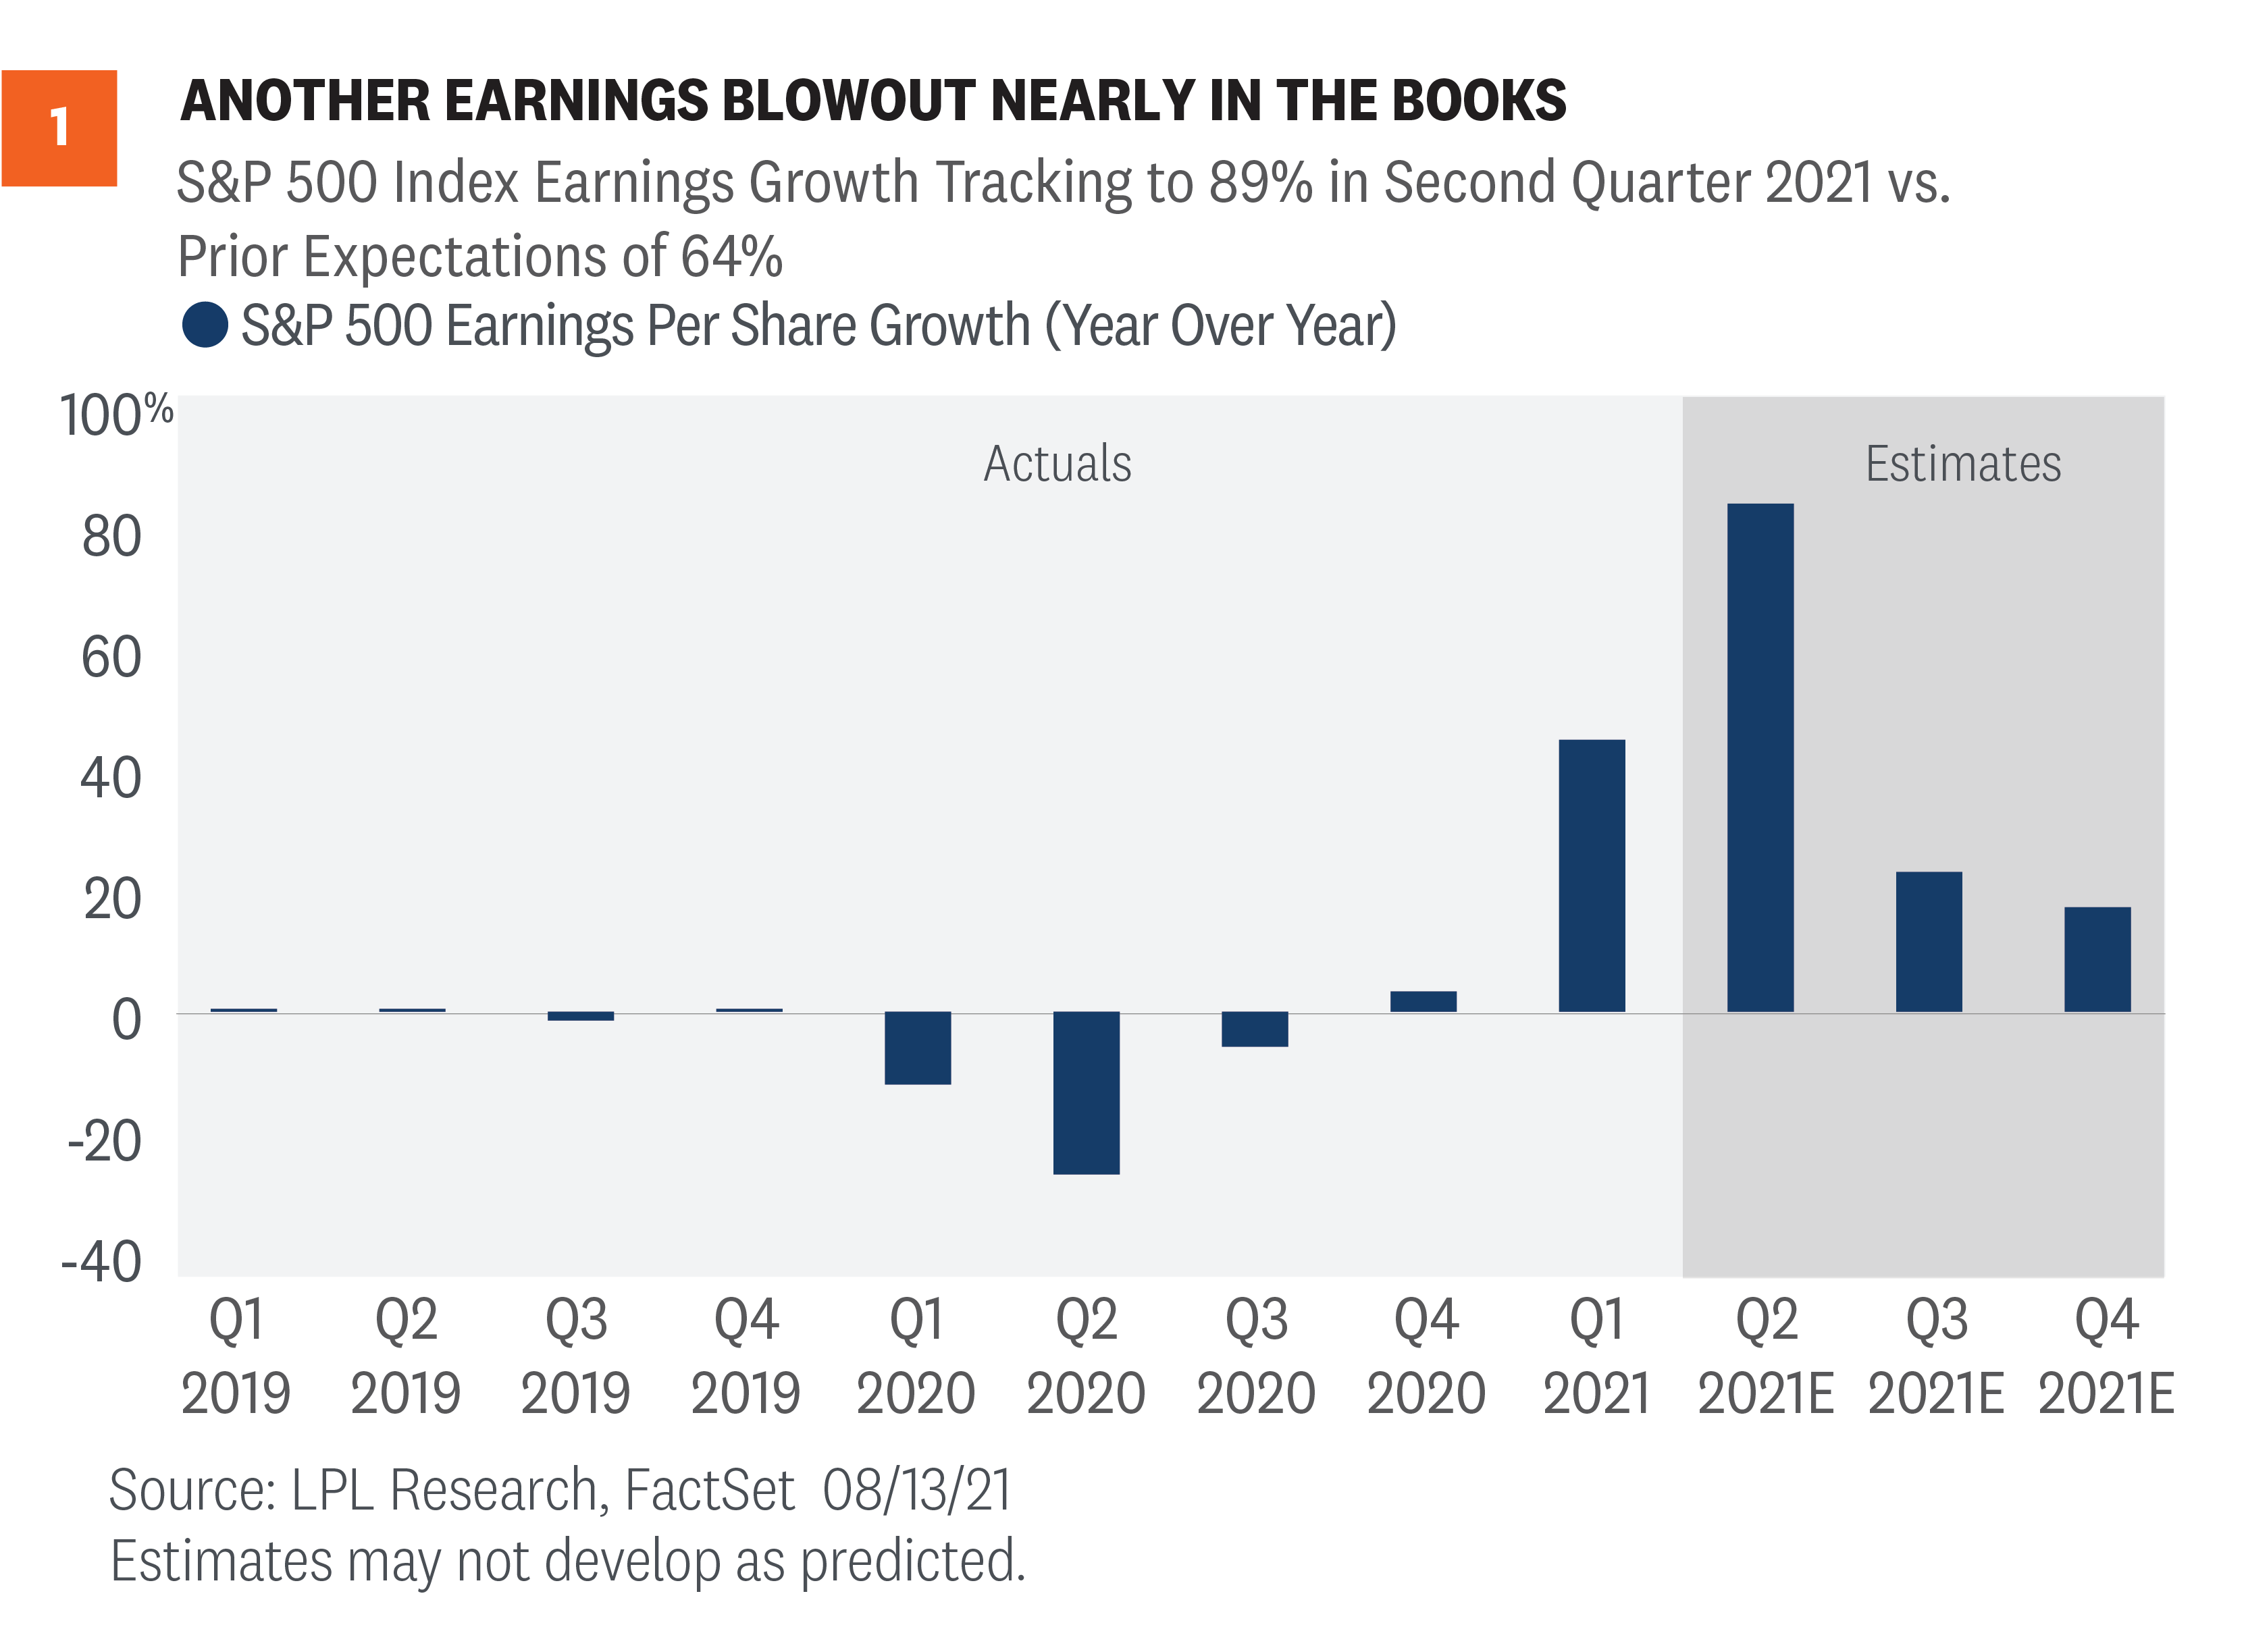
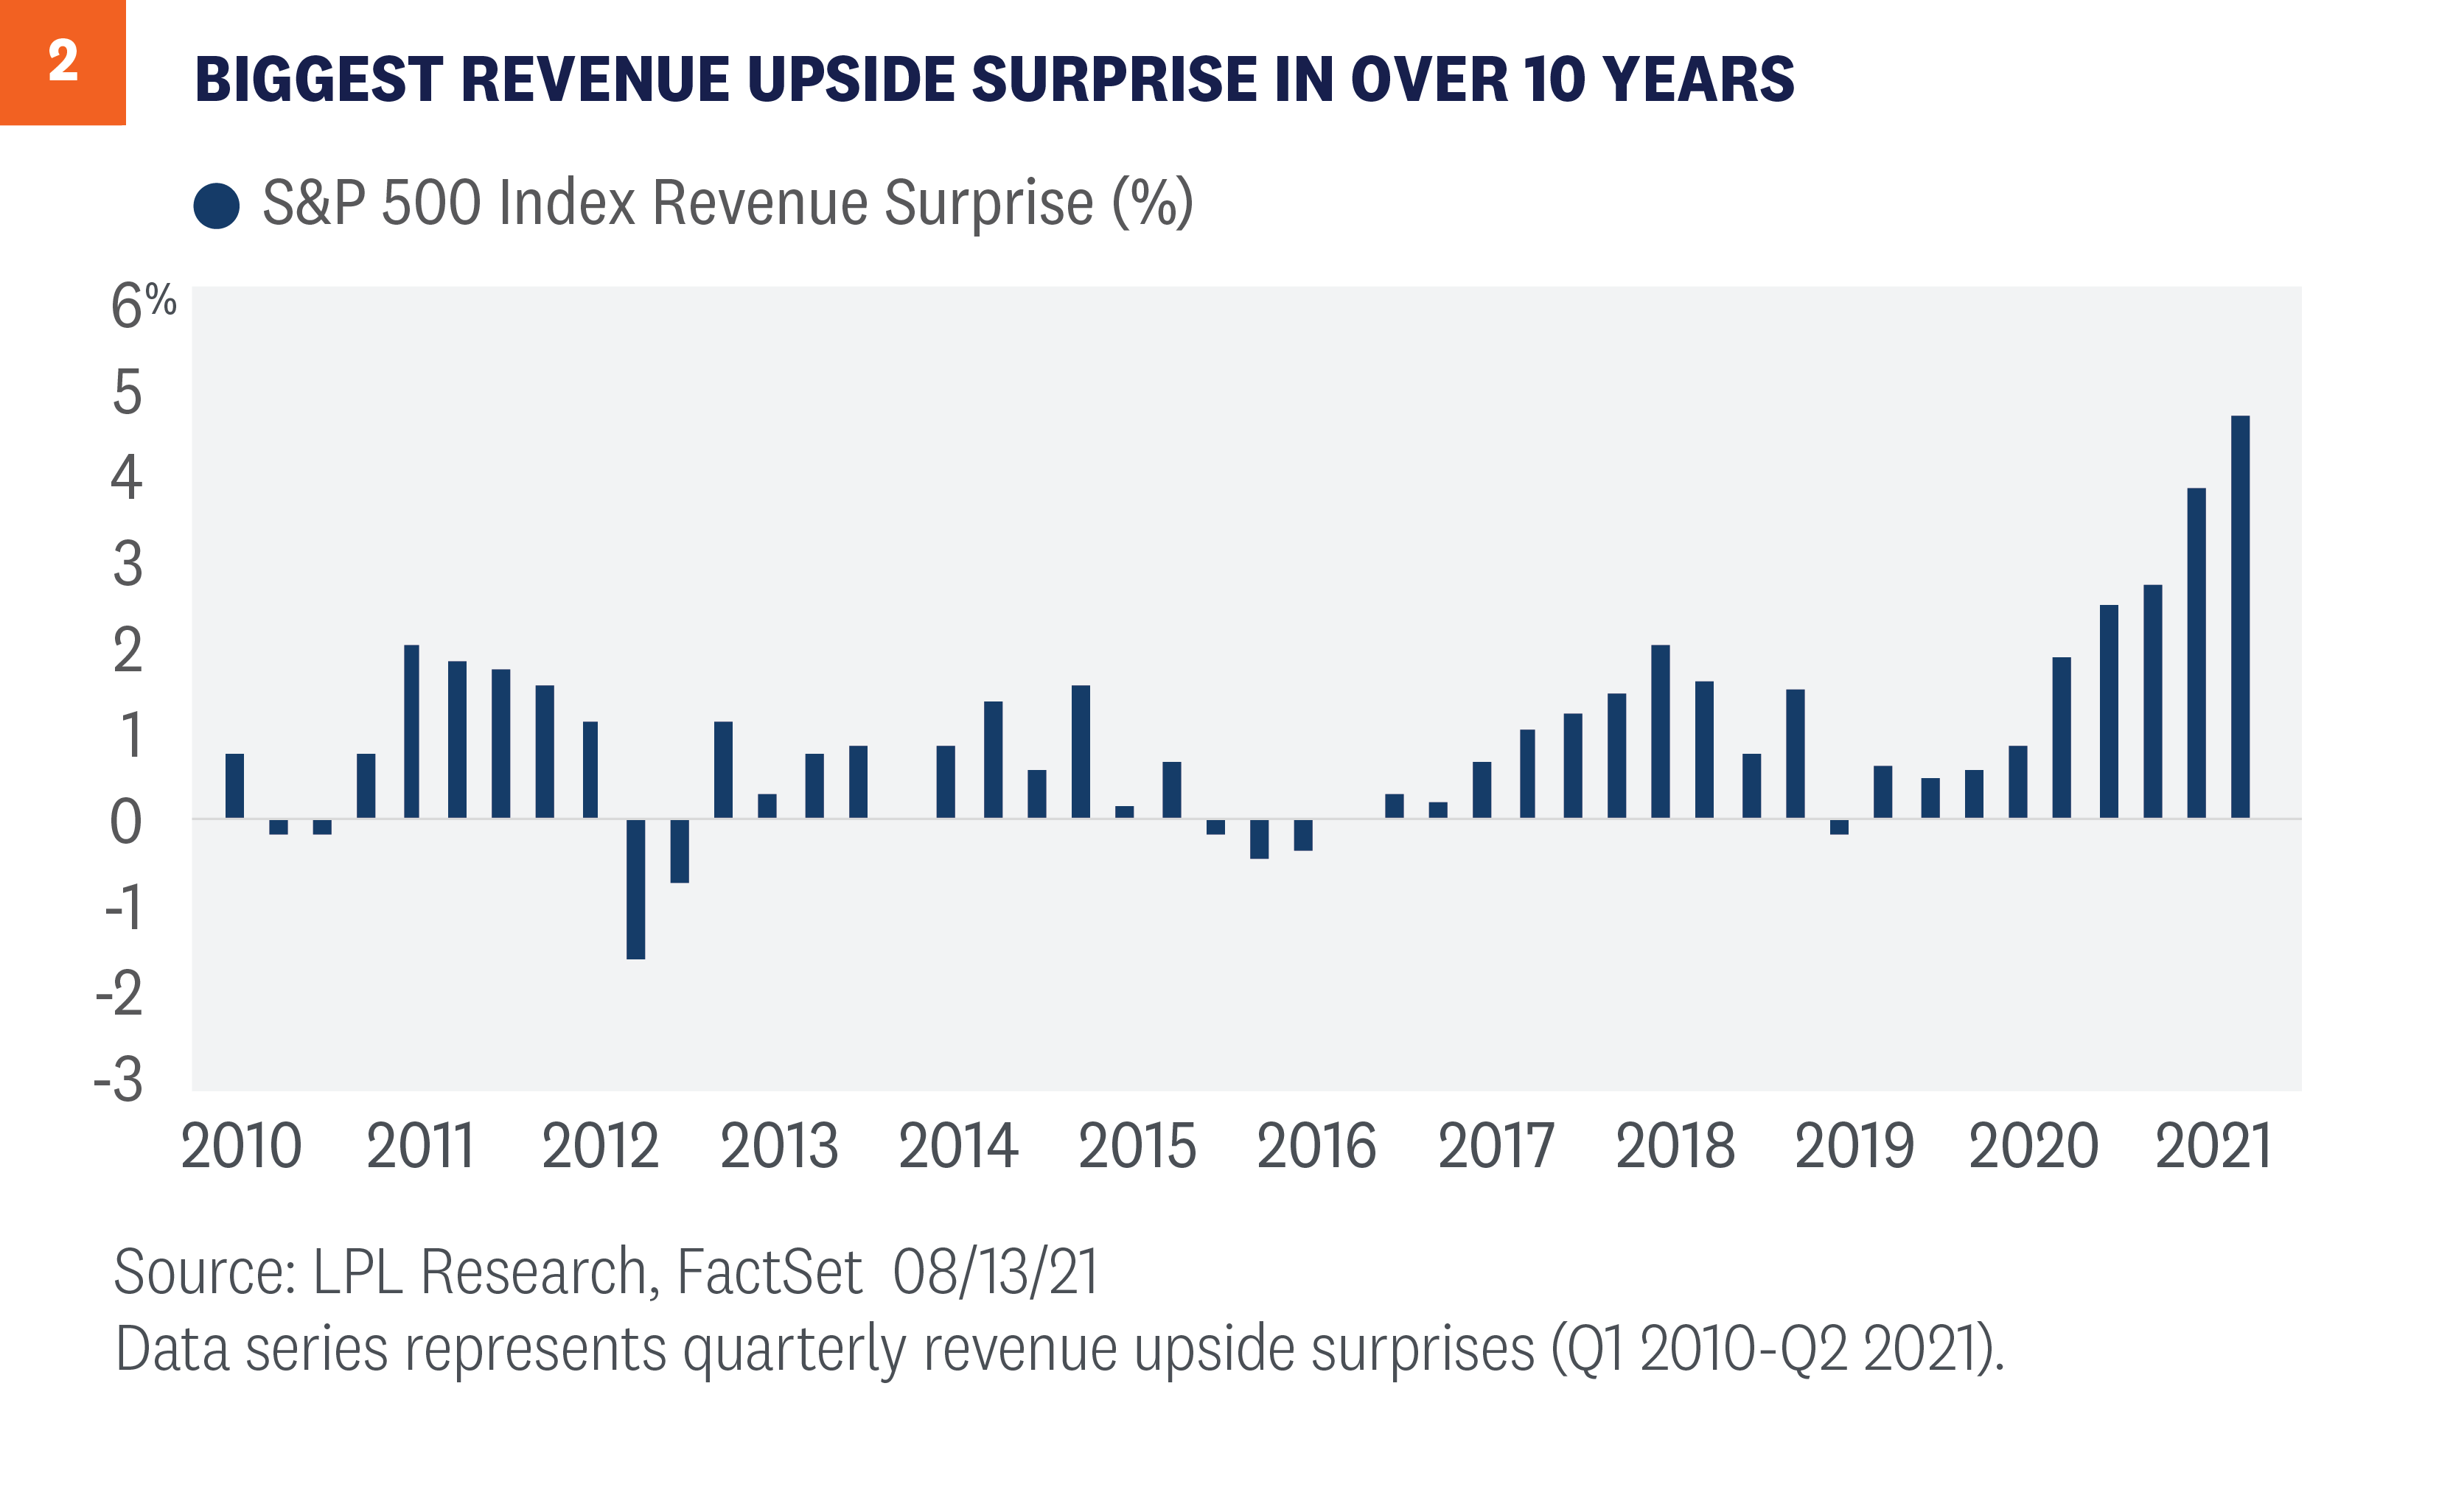
Corporate America did it again. Companies blew by estimates and made strategists and analysts look silly (though we humbly suggest that we may have looked less silly than most in our earnings preview on July 12). S&P 500 earnings growth did not surprise by quite as much as in the first quarter, but came pretty close—boosted by the biggest quarterly upside revenue surprise in at least 13 years. Here, we recap the strong numbers and raise our forecasts for earnings and for S&P 500 fair value at year-end.
BLOWOUT NUMBERS…AGAIN
In our earnings preview commentary in mid-July, we wrote that we expected another quarter of solid upside surprises. Huge earnings growth rates were never in question, considering that so much of the U.S. economy was shut down during the year-ago quarter. But strong second-quarter economic data and rising earnings estimates pointed to faster earnings growth than the consensus estimate implied on July 1. As shown in [Figure 1], S&P 500 earnings are tracking to a nearly 90% year-over-year increase, or about 25 percentage points above the consensus estimate when earnings season began. While a remarkable amount of upside, and still with 8% of S&P 500 companies left to report, it stands about 3 percentage points shy of the first quarter’s mind-blowing numbers when earnings grew 52% compared with the 24% estimate on April 1. Estimates are usually too low, but this amount of upside isn’t normal. Analysts and strategists often miss turns in economic conditions and underestimate companies’ ability to adapt to changing conditions. However, after four consecutive quarters of huge upside surprises, we expected analysts to catch up more quickly. The average upside since 2010 is about 6%, so a 10-point beat is spectacular. Two 20-point beats in a row is ridiculous. Revenue upside was especially impressive during the quarter, reflecting the improving economy and strong pricing power enjoyed by leading companies. In fact, the second quarter produced the biggest upside surprise to revenue ever recorded at 4.9 percentage points, breaking last quarter’s record of 4 points [Figure 2]. Energy more than doubled revenue year-over-year and delivered a more than 11% upside revenue surprise—the largest among all S&P 500 sectors. Revenue upside is encouraging because it is more likely to be sustained than cost cuts to prop up profit margins.
WHAT HAVE ANALYSTS MISSED?
Here are some of the reasons why we think analysts again dramatically underestimated the earnings power of corporate America during the second quarter:
Reopening continued largely uninterrupted. Steady progress in the reopening continued through June, perhaps catching some analysts off guard late in the quarter when the Delta variant of COVID-19 became more prevalent. Measures of mobility were generally resilient throughout the quarter.
Analysts may be too “micro” focused. Strong consumer spending and manufacturing activity might have both been underestimated again because analysts are too focused on the “micro,” leaving a structural blind spot to the “macro” picture that includes not only a big reopening push, but also a lot of stimulus spending still working its way through the economy. Caution from company management teams due to the ongoing uncertainty, which has been surprisingly persistent, has also likely been a factor.
Well-managed input cost pressures. Analysts may have gotten the timing wrong or overestimated the amount of input cost pressures that companies would be able to absorb (likely both). Pricing power has likely been underestimated and helped prop up record-setting margins. These pressures may still hit margins but that may be a quarter or two away.
Corporate efficiency is off the charts. Profit margins are at record highs, thanks to productivity-enhancing technology spending and cost savings (on business travel, entertainment, or office space, for example). These productivity enhancements will likely continue to bear fruit, though we do worry about wage pressures going forward—and some of those cost savings will likely reverse in coming quarters.
Financials delivered in a big way. The credit environment remains very healthy, boosting financial company results well beyond what analysts anticipated. Financials were by far the biggest sector contributor to earnings growth, and the average company beat earnings estimates by 27%—second only to consumer discretionary at 28%.
WHAT DO THESE STRONG RESULTS MEAN FOR THE OUTLOOK
The key question now is: Will the strong earnings momentum continue? We think so, although the amount of upside will likely continue to shrink in the second half, as it did between the first and second quarters. One reason for optimism is that estimates have risen during earnings season amid positive guidance. Nearly 60% of the guidance provided for the third quarter has been positive, well above the 5-year average at 37%. Since July 1, the consensus S&P 500 earnings per share (EPS) estimate has risen from $191 to $201. For 2022, the number has increased from $213 to near $219. Rising estimates tend to be a signal of more strong results ahead. In addition, although the second quarter may represent the peak of economic growth for this expansion, inventories need to be restocked. Second quarter 2021 gross domestic product (GDP) missed expectations largely because of inventory drawdowns. Restocking lifts earnings, on top of the likely boost from the reopening and stimulus. With substantially better second-quarter earnings results than we anticipated, rising forward estimates, and the strong economic growth outlook, our 2021 S&P 500 EPS estimate of $195 looks low. Maintaining the second-quarter EPS level for the next two quarters will put S&P 500 EPS at $205 for the full year 2021, a 46% year-over-year increase. Although our second-half estimates may appear conservative, we believe our forecast is reasonable given the risks surrounding the Delta variant and potential margin pressures (and consider consensus is only at $201). We have also raised our S&P 500 EPS forecast for 2022, from $205 to $218. We considered a higher forecast, but corporate tax increases are likely coming next year (in our view—we put the odds at about 70%). If those tax increases don’t happen, then we could potentially see S&P 500 EPS in 2022 of $225 or higher.
RAISING S&P 500 FAIR VALUE TARGET
As a result of the stronger earnings outlook, we are raising our 2021 year-end S&P 500 fair value target range from 4,400 – 4,450 to 4,650 – 4,700. The new target is based on a 21.5 PE and our revised 2022 S&P 500 EPS forecast. The midpoint of the new S&P 500 fair value target is 5% above the August 13 close and 5% above the midpoint of our prior target. We acknowledge there are risks to that higher forecast, with the Delta variant topping the list. Other concerns include potential “sticky” inflation, tax increases, historic deficit spending, U.S.-China tensions, and other geopolitical risks. We are also keenly aware that the second year of bull markets has historically brought more market volatility, the S&P 500 hasn’t experienced a 5% pullback in 10 months, stocks have already outpaced their average gain for the second year of a bull market, and August and September have historically been weaker months for stocks. So, while our base case is for stocks to add to stellar 2021 returns over the next four months, we remain on the lookout for bumps in the road as we discussed in our Midyear Outlook 2021: Picking Up Speed. Read previous editions of Weekly Market Commentary on lpl.com at News & Media. Jeff Buchbinder, CFA, Equity Strategist, LPL Financial
Ryan Detrick, CMT, Chief Market Strategist, LPL Financial ______________________________________________________________________________________________ IMPORTANT DISCLOSURES This material is for general information only and is not intended to provide specific advice or recommendations for any individual. There is no assurance that the views or strategies discussed are suitable for all investors or will yield positive outcomes. Investing involves risks including possible loss of principal. Any economic forecasts set forth may not develop as predicted and are subject to change. References to markets, asset classes, and sectors are generally regarding the corresponding market index. Indexes are unmanaged statistical composites and cannot be invested into directly. Index performance is not indicative of the performance of any investment and do not reflect fees, expenses, or sales charges. All performance referenced is historical and is no guarantee of future results. Any company names noted herein are for educational purposes only and not an indication of trading intent or a solicitation of their products or services. LPL Financial doesn’t provide research on individual equities. All information is believed to be from reliable sources; however, LPL Financial makes no representation as to its completeness or accuracy. US Treasuries may be considered “safe haven” investments but do carry some degree of risk including interest rate, credit, and market risk. Bonds are subject to market and interest rate risk if sold prior to maturity. Bond values will decline as interest rates rise and bonds are subject to availability and change in price. The Standard & Poor’s 500 Index (S&P500) is a capitalization-weighted index of 500 stocks designed to measure performance of the broad domestic economy through changes in the aggregate market value of 500 stocks representing all major industries. The PE ratio (price-to-earnings ratio) is a measure of the price paid for a share relative to the annual net income or profit earned by the firm per share. It is a financial ratio used for valuation: a higher PE ratio means that investors are paying more for each unit of net income, so the stock is more expensive compared to one with lower PE ratio. Earnings per share (EPS) is the portion of a company’s profit allocated to each outstanding share of common stock. EPS serves as an indicator of a company’s profitability. Earnings per share is generally considered to be the single most important variable in determining a share’s price. It is also a major component used to calculate the price-to-earnings valuation ratio. All index data from FactSet. Please read the full Midyear Outlook 2021: Picking Up Speed publication for additional description and disclosure. This research material has been prepared by LPL Financial LLC. Securities and advisory services offered through LPL Financial (LPL), a registered investment advisor and broker-dealer (member FINRA/SIPC). Insurance products are offered through LPL or its licensed affiliates. To the extent you are receiving investment advice from a separately registered independent investment advisor that is not an LPL affiliate, please note LPL makes no representation with respect to such entity. Not Insured by FDIC/NCUA or Any Other Government Agency | Not Bank/Credit Union Guaranteed | Not Bank/Credit Union Deposits or Obligations | May Lose Value
RES-857551-0821 | For Public Use | Tracking # 1-05179575 (Exp. 08/22)
Last week was a huge news week, from the Fed, to gross domestic product (GDP), to a giant week of earnings reports. Below we review the big events from last week, while also looking ahead to what could be an eventful August for investors.
Earnings Continue To Soar
Last week was a very busy week for quarterly earnings reports and as we wrote in Midyear Outlook 2021: Picking Up Speed, we expected strong earnings growth to support further gains for stocks in the second half of 2021. Well, the second half is only a month old, but corporate America has sure delivered so far this earnings season. With only about half of S&P 500 Index constituents having reported so far, earnings growth is tracking to a year-over-year increase of 85% (source: FactSet), more than 20 percentage points above the consensus expectation when earnings season began and well ahead of our optimistic upside target in the mid-to-high-70s. We thought the bar had been raised too high for that much upside. Clearly we were wrong. Growing earnings from the depressed year-ago quarter while much of the economy was shut down is not very impressive on its own. But blowing away analysts’ estimates after they’ve been consistently raised since last fall is very impressive, especially when considering ongoing challenges around COVID-19, supply chain bottlenecks, labor and materials shortages, and input cost pressures. The strong momentum doesn’t appear ready to stop anytime soon. Estimates have been rising as companies have shared their outlooks. The consensus estimate for 2022 has increased 1.7 percentage points since July 1, a strong result given the history of estimate reductions during reporting season and the fact that about half of the index has yet to report.
Latest From The Fed
Last week the July Federal Open Market Committee (FOMC) meeting provided no real surprises and no changes were made to current interest rate or bond purchasing policies. The Fed did acknowledge that the economy has made progress toward meeting employment and inflation goals; so, we’re getting closer to an official tapering announcement likely coming in the next few months. Chairman Jerome Powell said that the FOMC discussed the pace and composition of tapering but did not make any final decisions. He indicated that there is “little support” for tapering mortgage-backed securities (MBS) purchases first. The FOMC doesn’t formally meet again until September 21, but we may get additional details on the eventual removal of monetary accommodation at the Jackson Hole, WY, Economic Symposium which begins August 26. Additionally, the meeting minutes from the July FOMC meeting will be released on August 18, so we’re likely to get further details around the Fed’s plans to reduce its bond purchases at that time. Given the varying viewpoints within the Committee on tapering, the next meeting minutes could be market moving.
Big GDP Growth, But Still Misses
The other big event last week was second quarter GDP. The U.S. economy grew at a 6.5% annualized pace, well below the 8.5% that was expected, but still above the first quarter’s 6.3% pace according to the Bureau of Economic Analysis’ (BEA) preliminary estimate of real GDP. The composition of the growth largely reinforced the prevailing narratives of a strong consumer juxtaposed with supply chain bottlenecks, restricting growth. Consumer spending, as is typical, represented the dominant growth contributor, surging in the second quarter in part due to government transfer payments. Crucially, though, spending on services, which is largely in-person, bounced strongly, signaling an increased confidence among consumers to venture out. Business fixed investment came in strong and demonstrated businesses’ attempts to ramp up output to meet surging demand. Residential investment had a more predictable decline, as well-documented labor shortages and high materials costs are restricting new projects. The volatile inventory components, though, did represent a drag, but may reverse and provide a boost to growth in coming quarters. Looking forward, we expect continued growth in the third quarter but with a different composition. Consumer spending should still be respectable, but likely will recede a bit due to the fading impact of past government transfer payments and less impetus from the reopening. Business investment should continue to recover, though, and net exports may improve as the rest of the world plays catch-up to the U.S. in their recoveries, consuming more of our goods and services.
August Could Be Rough
At the start of the month we noted that July is the best month of the year for stocks in a post-election year; well, the bad news is August is quite weak in a post-election year. As Figure 1 shows, the S&P 500 Index is down 1.4% on average in post-election years, with only February worse. Taking things a step further, when August is lower, it can be really lower. In fact, since 1950, when August is negative it is down 3.9% on average, making it the worst month of the year when it is lower. Considering stocks are up six months in a row, the chances that a well-deserved pullback could happen are only increasing. Besides August’s weak historical performance, investors need to be aware that September is the worst month on average since 1950. Even more recently stocks have struggled during these two months, as they are the only two months with a negative average return over the past 10- and 20-year periods. That being said, we believe the magnitude of a pullback could be limited by a solid economic backdrop, strong earnings momentum, corporate buyback activity, and attractive valuations for stocks relative to cash and high-quality bonds. We’ve also seen the 50-day moving average consistently provide support for stocks so far this year, and that level is currently just 3% below where the S&P 500 Index is trading at this time.
China Regulations Heat Up
China’s stock market has been hit hard in response to several sudden regulatory actions that have concerned investors. First came the crackdown on ride sharing service DiDi, which has about a 90% market share in China. Regulators had announced a cybersecurity review soon after its initial public offering on the New York Stock Exchange (NYSE), eventually ordering the removal of DiDi from app stores. Then there were fines against tech giants Alibaba and Tencent. Next came an announcement that for-profit tutoring services would no longer be able to charge for certain core classes. The rapid sequence of government action against publicly traded companies has shaken market participants. Hong Kong’s Hang Seng Index sold off nearly 15% in about a month. China has been seeking increased access to international capital markets for decades, but free market mechanisms are not sitting well with an increasingly authoritarian style of government. Chinese officials have more recently taken a more conciliatory tone to try to settle markets back down, but broken trust is not easily restored. Recent price declines may bring opportunities and China’s economy continues to thrive, but we don’t believe the added uncertainty from possible government interference has yet been fully priced in. How things play out in August may set the tone for the rest of the year.
Conclusion
Market moving events happen all the time, but last week was one of the largest of the year. With stocks still flirting with all-time highs, the bar could be set quite high and any disappointment could lead to a pullback or correction. However, we continue to believe the earnings being generated by U.S. companies are strong enough to justify current valuations, and that stocks may add to strong year-to-date returns over the next five months even with a potential increase in volatility that tends to occur during the second year of bull markets. We continue to recommend a modest overweight allocation to stocks relative to bonds. As we head into the historically volatile months of August – October, investors need to be ready for some potential big moves. Could it be the Fed, inflation, China, or something else that causes the volatility? Stay tuned, but we’ll be here to explain it whatever it is. For more of our thoughts on the rest of this year, we invite you to read the full Midyear Outlook 2021: Picking Up Speed for more investment insights, and for the interactive version, click here.Thanks to Tom Goulder and Lawrence Gillum for their help this week.
______________________________________________________________________________________________ IMPORTANT DISCLOSURES This material is for general information only and is not intended to provide specific advice or recommendations for any individual. There is no assurance that the views or strategies discussed are suitable for all investors or will yield positive outcomes. Investing involves risks including possible loss of principal. Any economic forecasts set forth may not develop as predicted and are subject to change. References to markets, asset classes, and sectors are generally regarding the corresponding market index. Indexes are unmanaged statistical composites and cannot be invested into directly. Index performance is not indicative of the performance of any investment and do not reflect fees, expenses, or sales charges. All performance referenced is historical and is no guarantee of future results. Any company names noted herein are for educational purposes only and not an indication of trading intent or a solicitation of their products or services. LPL Financial doesn’t provide research on individual equities. All information is believed to be from reliable sources; however, LPL Financial makes no representation as to its completeness or accuracy. US Treasuries may be considered “safe haven” investments but do carry some degree of risk including interest rate, credit, and market risk. Bonds are subject to market and interest rate risk if sold prior to maturity. Bond values will decline as interest rates rise and bonds are subject to availability and change in price. The Standard & Poor’s 500 Index (S&P500) is a capitalization-weighted index of 500 stocks designed to measure performance of the broad domestic economy through changes in the aggregate market value of 500 stocks representing all major industries. The PE ratio (price-to-earnings ratio) is a measure of the price paid for a share relative to the annual net income or profit earned by the firm per share. It is a financial ratio used for valuation: a higher PE ratio means that investors are paying more for each unit of net income, so the stock is more expensive compared to one with lower PE ratio. Earnings per share (EPS) is the portion of a company’s profit allocated to each outstanding share of common stock. EPS serves as an indicator of a company’s profitability. Earnings per share is generally considered to be the single most important variable in determining a share’s price. It is also a major component used to calculate the price-to-earnings valuation ratio. All index data from FactSet. Please read the full Midyear Outlook 2021: Picking Up Speed publication for additional description and disclosure. This research material has been prepared by LPL Financial LLC. Securities and advisory services offered through LPL Financial (LPL), a registered investment advisor and broker-dealer (member FINRA/SIPC). Insurance products are offered through LPL or its licensed affiliates. To the extent you are receiving investment advice from a separately registered independent investment advisor that is not an LPL affiliate, please note LPL makes no representation with respect to such entity.
Not Insured by FDIC/NCUA or Any Other Government Agency | Not Bank/Credit Union Guaranteed | Not Bank/Credit Union Deposits or Obligations | May Lose Value
RES-844300-0721 | For Public Use | Tracking # 1-05173990 (Exp. 07/22)
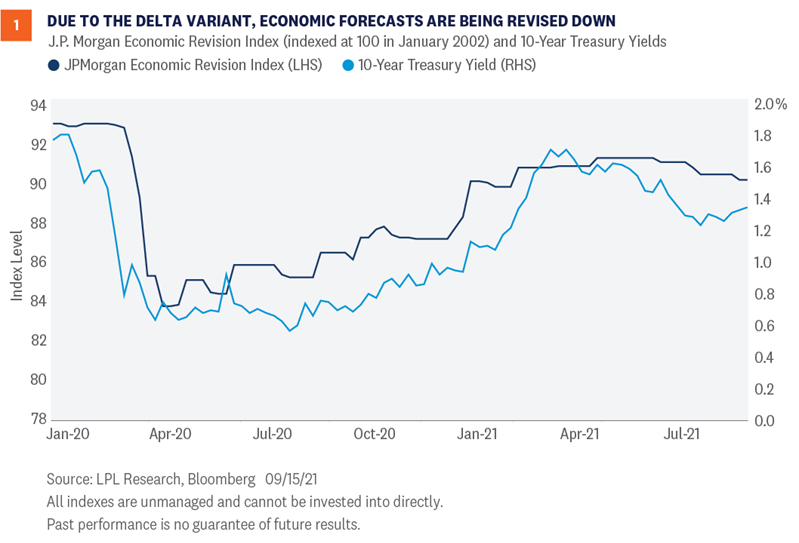
Until recently, we expected the 10-year Treasury yield to end the year between 1.75% and 2.0%. Now, however, there are two key elements suggesting we are unlikely to see significantly higher interest rates by year end: The Delta variant’s impact on economic growth expectations, and the continued demand for U.S. Treasuries by foreign investors. As such, our new year-end target for the 10-year Treasury yield is between 1.50% and 1.75%. Coming into the year, and into our 2021 mid-year outlook, we expected Treasury yields would move higher than current levels. Higher inflation expectations, less involvement in the bond market by the Federal Reserve (Fed), and a record amount of Treasury issuance this year were all reasons we thought interest rates could end the year between 1.75% and 2.0%. Now, however, there are two key elements suggesting we’re unlikely to see significantly higher interest rates by year-end. The Delta variant’s impact on economic growth expectations and the continued demand for U.S. Treasuries by foreign investors are likely to limit the upside in long-term Treasury yields. As such, we are slightly lowering our year-end forecast for the 10-year Treasury yield. We now believe the 10-year Treasury yield will end the year between 1.50% and 1.75%.
Delta Variant Delying Full Economic Growth Potential
A key variable in determining the direction and level of interest rates is the expected growth rate of the economy. With everything else being equal, if the gross domestic product (GDP) growth rate is expected to increase, long-term Treasury yields tend to increase as well. The reverse is also generally true. Going into the COVID-19 lockdowns, we saw both growth expectations and 10-year Treasury yields fall significantly. However, as seen in Figure 1, after the successful development of the COVID-19 vaccines in early January, GDP growth expectations were generally revised higher (JPMorgan’s Economic Revision Index rises as economists’ expectations for economic growth improve). As such, long-term interest rates generally moved higher as well. However, due to the persistence of the Delta variant, we are starting to see GDP growth forecasts revised lower. That has kept interest rates relatively anchored at current levels. We think any potential slowdown in growth will be temporary, with future growth expectations eventually rising as the impact of the Delta variant wanes and the economy bounces back again, which we think will likely take place over the next six to 12 months. Until then though, long-term interest rates may have difficulty moving significantly higher from current levels.
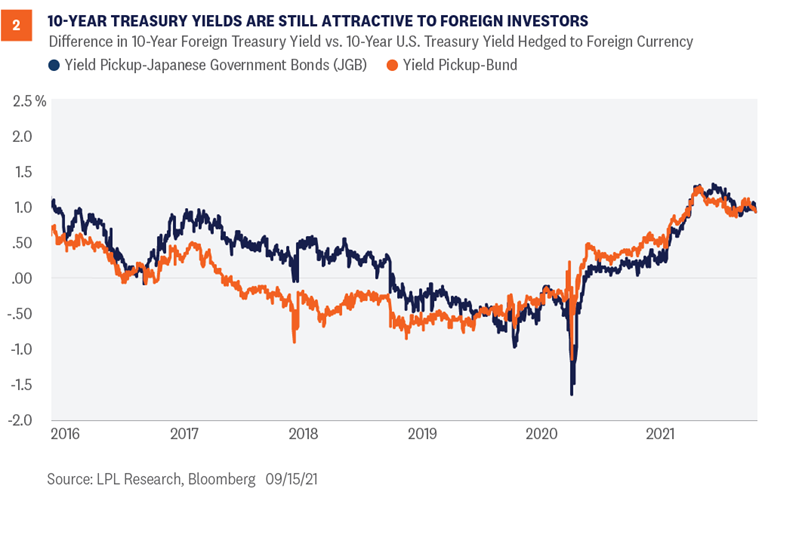
Foreign Investors Still Incentivized to Invest in U.S. Treasuries
Another key reason we believe interest rates have not moved much higher this year is foreign investors’ interest in the U.S. Treasury markets. Global interest rates remain low by historical standards and compared to U.S. Treasury yields. In fact, a number of countries have 10-year Treasury yields close to 0.0% or even negative in certain countries. Aging demographics and strong social support programs have made many Japanese and European investors look outside of their home countries to help fund underfunded pension schemes. Currently, there remains nearly $15 trillion in negative-yielding debt globally, which makes the 1.33% 10-year Treasury yield (as of September 16) look extremely attractive. Moreover, when investing in U.S. markets, foreign investors have to be mindful of the currency risk associated with U.S. investments. Because foreign investors’ liabilities are denominated in their home currency, most foreign investors hedge out the dollar risk embedded within U.S. investments. There is a cost to hedging out that risk though, which limits the attractiveness of those cross-border investments. But as shown in Figure 2, even after considering those costs the yield pickup relative to Japanese government bonds (JGB) and/or German bunds can be substantial. Japanese and German/European investors in particular can earn an additional 1% per year by investing in U.S. Treasuries. While that may not sound like much, the alternative for many German/European investors is to pay the government 0.30% per year for 10 years for the right to own that debt. In this low-rate environment, any incremental yield pickup is welcome. As the Fed starts to raise short-term interest rates—likely in 2023—the costs to hedge the currency risk increases. But until then, the incentive for cross-border investment remains, which will likely constrain the amount of upside we will see in long-term U.S. yields through the end of 2021.
All Eyes on the Federal Reserve
The Fed is meeting this week to discuss its ongoing commitment to its asset purchase program. Since March 2020, the Fed has supported the economy and financial markets by purchasing $120 billion in Treasury and mortgage securities, and by keeping short-term interest rates near zero. As the economy continues to recover, however, the need for continued monetary support wanes. Coming into the year, we identified Fed policy as a key risk to higher yields. The last time the Fed was in the position to reduce/taper its bond purchases, then-Chairman Ben Bernanke surprised markets by casually mentioning that the Fed would start to taper its bond-buying programs in the coming months. His comments caught equity and fixed income investors by surprise and both markets reacted negatively—although the equity markets went on to return 30% for the year. While we are in a similar situation today with the Fed likely to formally announce its intentions to taper its bond-buying programs soon, the markets have no reason to be surprised. The Fed has been communicating its intentions to eventually taper bond purchases for several months now. Markets should be well prepared at this point as the Fed learned its lesson from 2013 and has done a much better job communicating its intentions. As such, we do not envision another “taper tantrum” event that causes interest rates to spike higher.
Conclusion
Near-term inflation expectations above historical trends, less involvement in the bond market by the Fed, and improving growth expectations once the Delta variant recedes are all reasons why we believe interest rates will move moderately higher from current levels. We expect the 10-year Treasury yield to end the year between 1.50% and 1.75%. We may see even higher yields next year, but an aging global demographic that needs income, higher global debt levels, and an ongoing bull market in equities (which potentially means more frequent rebalancing into fixed income) may keep interest rates from going substantially higher in 2022 as well. Read previous editions of Weekly Market Commentary on lpl.com at News & Media. Lawrence Gillum, CFA, Fixed Income Strategist, LPL Financial
Ryan Detrick, CMT, Chief Market Strategist, LPL Financial ______________________________________________________________________________________________ IMPORTANT DISCLOSURES This material is for general information only and is not intended to provide specific advice or recommendations for any individual. There is no assurance that the views or strategies discussed are suitable for all investors or will yield positive outcomes. Investing involves risks including possible loss of principal. Any economic forecasts set forth may not develop as predicted and are subject to change. References to markets, asset classes, and sectors are generally regarding the corresponding market index. Indexes are unmanaged statistical composites and cannot be invested into directly. Index performance is not indicative of the performance of any investment and do not reflect fees, expenses, or sales charges. All performance referenced is historical and is no guarantee of future results. Any company names noted herein are for educational purposes only and not an indication of trading intent or a solicitation of their products or services. LPL Financial doesn’t provide research on individual equities. All information is believed to be from reliable sources; however, LPL Financial makes no representation as to its completeness or accuracy. US Treasuries may be considered “safe haven” investments but do carry some degree of risk including interest rate, credit, and market risk. Bonds are subject to market and interest rate risk if sold prior to maturity. Bond values will decline as interest rates rise and bonds are subject to availability and change in price. The Standard & Poor’s 500 Index (S&P500) is a capitalization-weighted index of 500 stocks designed to measure performance of the broad domestic economy through changes in the aggregate market value of 500 stocks representing all major industries. The PE ratio (price-to-earnings ratio) is a measure of the price paid for a share relative to the annual net income or profit earned by the firm per share. It is a financial ratio used for valuation: a higher PE ratio means that investors are paying more for each unit of net income, so the stock is more expensive compared to one with lower PE ratio. Earnings per share (EPS) is the portion of a company’s profit allocated to each outstanding share of common stock. EPS serves as an indicator of a company’s profitability. Earnings per share is generally considered to be the single most important variable in determining a share’s price. It is also a major component used to calculate the price-to-earnings valuation ratio. All index data from FactSet. Please read the full Midyear Outlook 2021: Picking Up Speed publication for additional description and disclosure. This research material has been prepared by LPL Financial LLC. Securities and advisory services offered through LPL Financial (LPL), a registered investment advisor and broker-dealer (member FINRA/SIPC). Insurance products are offered through LPL or its licensed affiliates. To the extent you are receiving investment advice from a separately registered independent investment advisor that is not an LPL affiliate, please note LPL makes no representation with respect to such entity. Not Insured by FDIC/NCUA or Any Other Government Agency | Not Bank/Credit Union Guaranteed | Not Bank/Credit Union Deposits or Obligations | May Lose Value
RES-894867-0921 | For Public Use | Tracking # 1-05191527 (Exp. 09/22)
First and foremost, this week’s commentary should not be construed to suggest that we are saying stocks will go up forever. We are also not saying that stocks are immune from a pullback in the final four months of 2021. Corrections are a normal part of investing and the S&P 500 Index has yet to pull back even 5% so far this year, something that happens on average three times per year. However, we remain steadfastly bullish and this week want to explore five things that some bears believe that do not worry us.
Bear Argument #1: Equities Have Gone Too Far, Too Fast
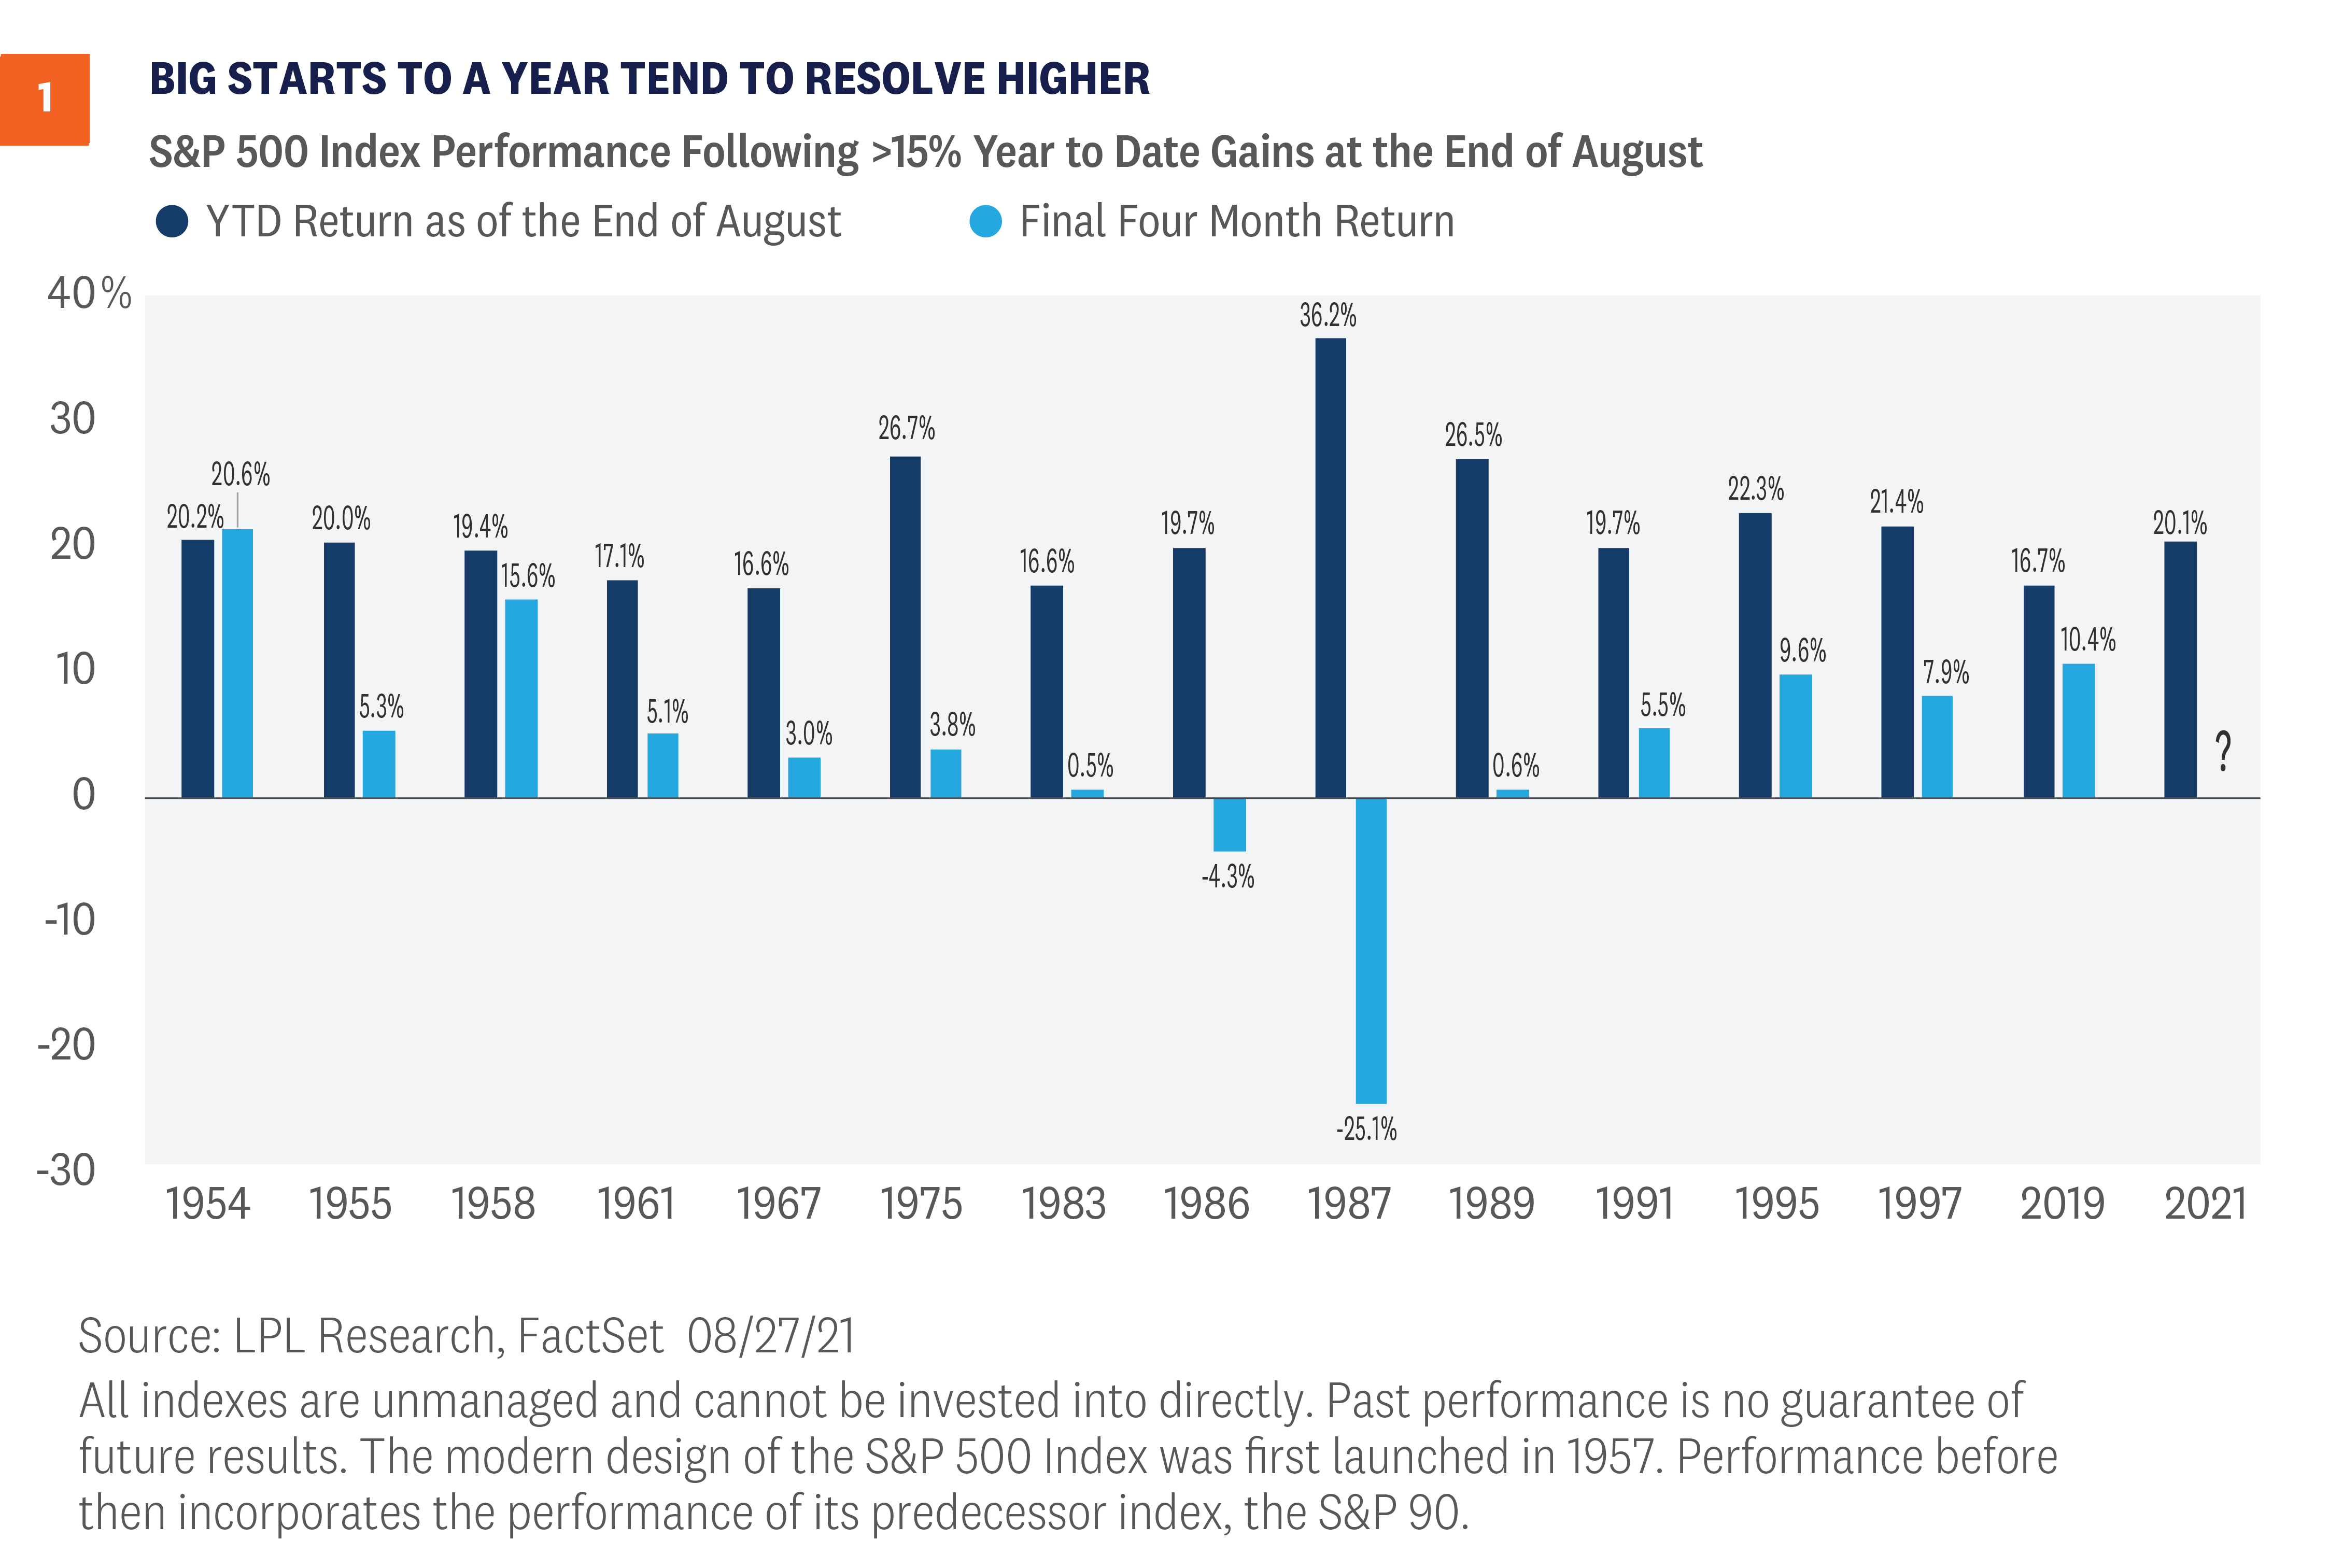
2021 has been an amazing year for stocks, with the S&P 500 up approximately 20% for the year without so much as a 5% pullback. Additionally, it has made 52 new all-time highs so far. To put in context how rare this is, only 1964 and 1995 saw more than 50 new highs before August was over. In fact, the all-time record for new highs in one year is 77, set in 1995, and this year is on pace to come very close to that record. What should investors do now? One of the common bear worries is stocks moving up a lot means stocks will come down a lot. That simply isn’t true, fortunately. In fact, as [Figure 1] shows, when the S&P 500 is up more than 15% year to date at the end of August (as 2021 likely will be), the final four months have been up the past five times, with the last three up 9.6%, 7.9%, and 10.4%, respectively. In fact, the average return in the final four months after a great start to the year is 4.2%, with a very impressive median return of 5.2%. Both numbers are above the average, and the median return for all years during the final four months is 3.6%.
Bear Argument #2: Strong Earnings Have Just Been Due To Easy Comps
The economy’s remarkable stimulus-aided recovery from the swift but severe pandemic recession of 2020 set the stage for a tremendous earnings surge that has been going on for a year now. And it is true that a good portion of that growth was due to the lockdowns in the year-ago quarter boosting the growth rate. But that isn't the whole story—not even close. Our S&P 500 earnings per share (EPS) estimates for 2021 is now $205, up 46% from $140 in 2020 and—even more impressively—26% above the pre-pandemic level of $163 in 2019. These earnings gains have prevented stocks from getting more expensive this year, as the price-to-earnings ratio for the S&P 500 has held steady despite the index’s 20% year-to-date advance. In our second-quarter earnings preview, we posed the question, “Is this as good as it gets?” The answer is almost certainly yes, as the 90% second-quarter growth rate probably won't be duplicated for a long time. However, we expect earnings to grow at a very solid pace of over 20% in the third and fourth quarters. Companies generally provided optimistic outlooks during earnings season with 58% of the guidance being positive compared with the 5-year average of 37%, which we believe increases the likelihood of better-than-expected results for the next quarter or two. We can’t entirely dismiss the risks, including the Delta variant, supply chain disruptions, and inflation pressures—particularly wages. But we expect corporate America’s efficiency and the strength of the reopening to continue to power earnings ahead and lead to additional gains for stocks over the rest of 2021.
Bear Argument #3: Cyclical Stocks Are Flashing a Warning Sign
It is true that cyclical stocks have largely underperformed the market over the past several months. The Dow Jones Transportation Average topped out in early May, while areas like banks and small caps have been going sideways for even longer. However, the context of these moves is lost when looking purely at recent performance. All of these sectors and asset classes have seen sideways action following historic runs from Q4 2020 into the early part of this year. However, despite recent underperformance, all of these groups remain above upward-sloping 200-day moving averages, a sign that the uptrends are firmly intact. We believe that recent underperformance is simply working off extreme overbought conditions, but those conditions are bullish over the longer-term. Perhaps most importantly though, we are seeing signs that this underperformance may be coming to an end. Last week, small caps outperformed large by the most since March. Banks have seen an expansion in new highs, and airlines, which have been one of the biggest drags on transports over recent months, are actually up 8% over the past six weeks despite fears surrounding Delta. The final variable to watch may be interest rates, which are highly correlated with cyclical and small-cap outperformance. We believe the yield on the 10-year Treasury has seen the bottom and is poised to continue higher through year-end.
Bear Argument #4: A Taper Tantrum is Coming
According to recent investor surveys, equity and fixed income investors are worried about a potential “taper tantrum” when the Federal Reserve (Fed) starts to reduce its bond-buying programs. As a reminder, in 2013, Fed Chairman Ben Bernanke casually mentioned that the Fed would start to reduce (taper) its bond buying programs in the coming months. His comments caught equity and fixed income investors by surprise and both markets reacted negatively—although the equity markets went on to return 30% for the year. While we are in a similar situation today with the Fed ready to announce its intentions to taper its bond buying programs, the markets have no reason to be surprised. The Fed has been communicating its intentions to eventually taper bond purchases for several months now. Markets should be well prepared at this point as the Fed learned its lesson from 2013 and has done a much better job communicating its intentions. Moreover, we think we are still several years away from full monetary normalization. After tapering ends, the Fed will likely wait some time before it starts to raise short-term interest rates. Last time we were in this position (in 2013), it was two years before the Fed began to increase interest rates, which took place over a four-year horizon. Former Fed Chair William McChesney Martin famously quipped that the job of the Federal Reserve is "to take away the punch bowl just as the party gets going." We don’t think the current Fed is going to take away the punch bowl anytime soon, and expect it will remain accommodative for the foreseeable future.
Bear Argument #5: The White House Agenda Will Derail The Bull
We don’t think Washington policy developments are a serious threat to broad markets in the near-to-medium term. We know that people get passionate about policy and that’s a good thing—that’s what makes a democracy go. But a direct connection between policy and broader market direction is rare. Even when it comes to the narrow impact of policy on an individual sector or industry, the outcome for markets may not be in line with what conventional wisdom expects—or may be overwhelmed by larger economic forces. Policy does matter, but unless there’s a glaring mistake, it’s unlikely to be a policy decision that takes the bull market down. President Biden’s agenda is likely a mixed bag for markets. Markets tend to respond positively to stimulus, and we believe we may see a total of $2–2.5 trillion in new spending, spread out over about 10 years, passed by the end of the year. But higher taxes could be a headwind, and that additional spending may be paid for, in part, by $1–1.5 trillion in new taxes, the rest coming through borrowing. But either way the primary driver of the recovery will continue to be businesses looking for better ways to compete, innovate, and grow. That’s a powerful force, and market history says compared to that what happens in Washington is usually not enough of a catalyst to reverse market momentum.
Conclusion
LPL Research continues to believe that tactical investors should tilt portfolios in favor of stocks over bonds. This certainly does not mean that an exogenous shock could not cause stocks to correct. However, when looking at the recent pace of earnings, the policy environment, and market history, we fail to see a compelling bear case against equities. For more information, please read our Midyear Outlook 2021: Picking Up Speed. Please note: We will not publish a Weekly Market Commentary next week in observance of the Labor Day holiday. We will resume our regular schedule on September 13. Read previous editions of Weekly Market Commentary on lpl.com at News & Media. Ryan Detrick, CMT, Chief Market Strategist, LPL Financial
Jeff Buchbinder, CFA, Equity Strategist, LPL Financial
Scott Brown, CMT, Senior Analyst, LPL Financial ______________________________________________________________________________________________ IMPORTANT DISCLOSURES This material is for general information only and is not intended to provide specific advice or recommendations for any individual. There is no assurance that the views or strategies discussed are suitable for all investors or will yield positive outcomes. Investing involves risks including possible loss of principal. Any economic forecasts set forth may not develop as predicted and are subject to change. References to markets, asset classes, and sectors are generally regarding the corresponding market index. Indexes are unmanaged statistical composites and cannot be invested into directly. Index performance is not indicative of the performance of any investment and do not reflect fees, expenses, or sales charges. All performance referenced is historical and is no guarantee of future results. Any company names noted herein are for educational purposes only and not an indication of trading intent or a solicitation of their products or services. LPL Financial doesn’t provide research on individual equities. All information is believed to be from reliable sources; however, LPL Financial makes no representation as to its completeness or accuracy. U.S. Treasuries may be considered “safe haven” investments but do carry some degree of risk including interest rate, credit, and market risk. Bonds are subject to market and interest rate risk if sold prior to maturity. Bond values will decline as interest rates rise and bonds are subject to availability and change in price. The Standard & Poor’s 500 Index (S&P500) is a capitalization-weighted index of 500 stocks designed to measure performance of the broad domestic economy through changes in the aggregate market value of 500 stocks representing all major industries. The PE ratio (price-to-earnings ratio) is a measure of the price paid for a share relative to the annual net income or profit earned by the firm per share. It is a financial ratio used for valuation: a higher PE ratio means that investors are paying more for each unit of net income, so the stock is more expensive compared to one with lower PE ratio. Earnings per share (EPS) is the portion of a company’s profit allocated to each outstanding share of common stock. EPS serves as an indicator of a company’s profitability. Earnings per share is generally considered to be the single most important variable in determining a share’s price. It is also a major component used to calculate the price-to-earnings valuation ratio. All index data from FactSet. Please read the full Midyear Outlook 2021: Picking Up Speed publication for additional description and disclosure. This research material has been prepared by LPL Financial LLC. Securities and advisory services offered through LPL Financial (LPL), a registered investment advisor and broker-dealer (member FINRA/SIPC). Insurance products are offered through LPL or its licensed affiliates. To the extent you are receiving investment advice from a separately registered independent investment advisor that is not an LPL affiliate, please note LPL makes no representation with respect to such entity. Not Insured by FDIC/NCUA or Any Other Government Agency | Not Bank/Credit Union Guaranteed | Not Bank/Credit Union Deposits or Obligations | May Lose Value
RES-873950-0821 | For Public Use | Tracking # 1-05184665 (Exp. 08/22)
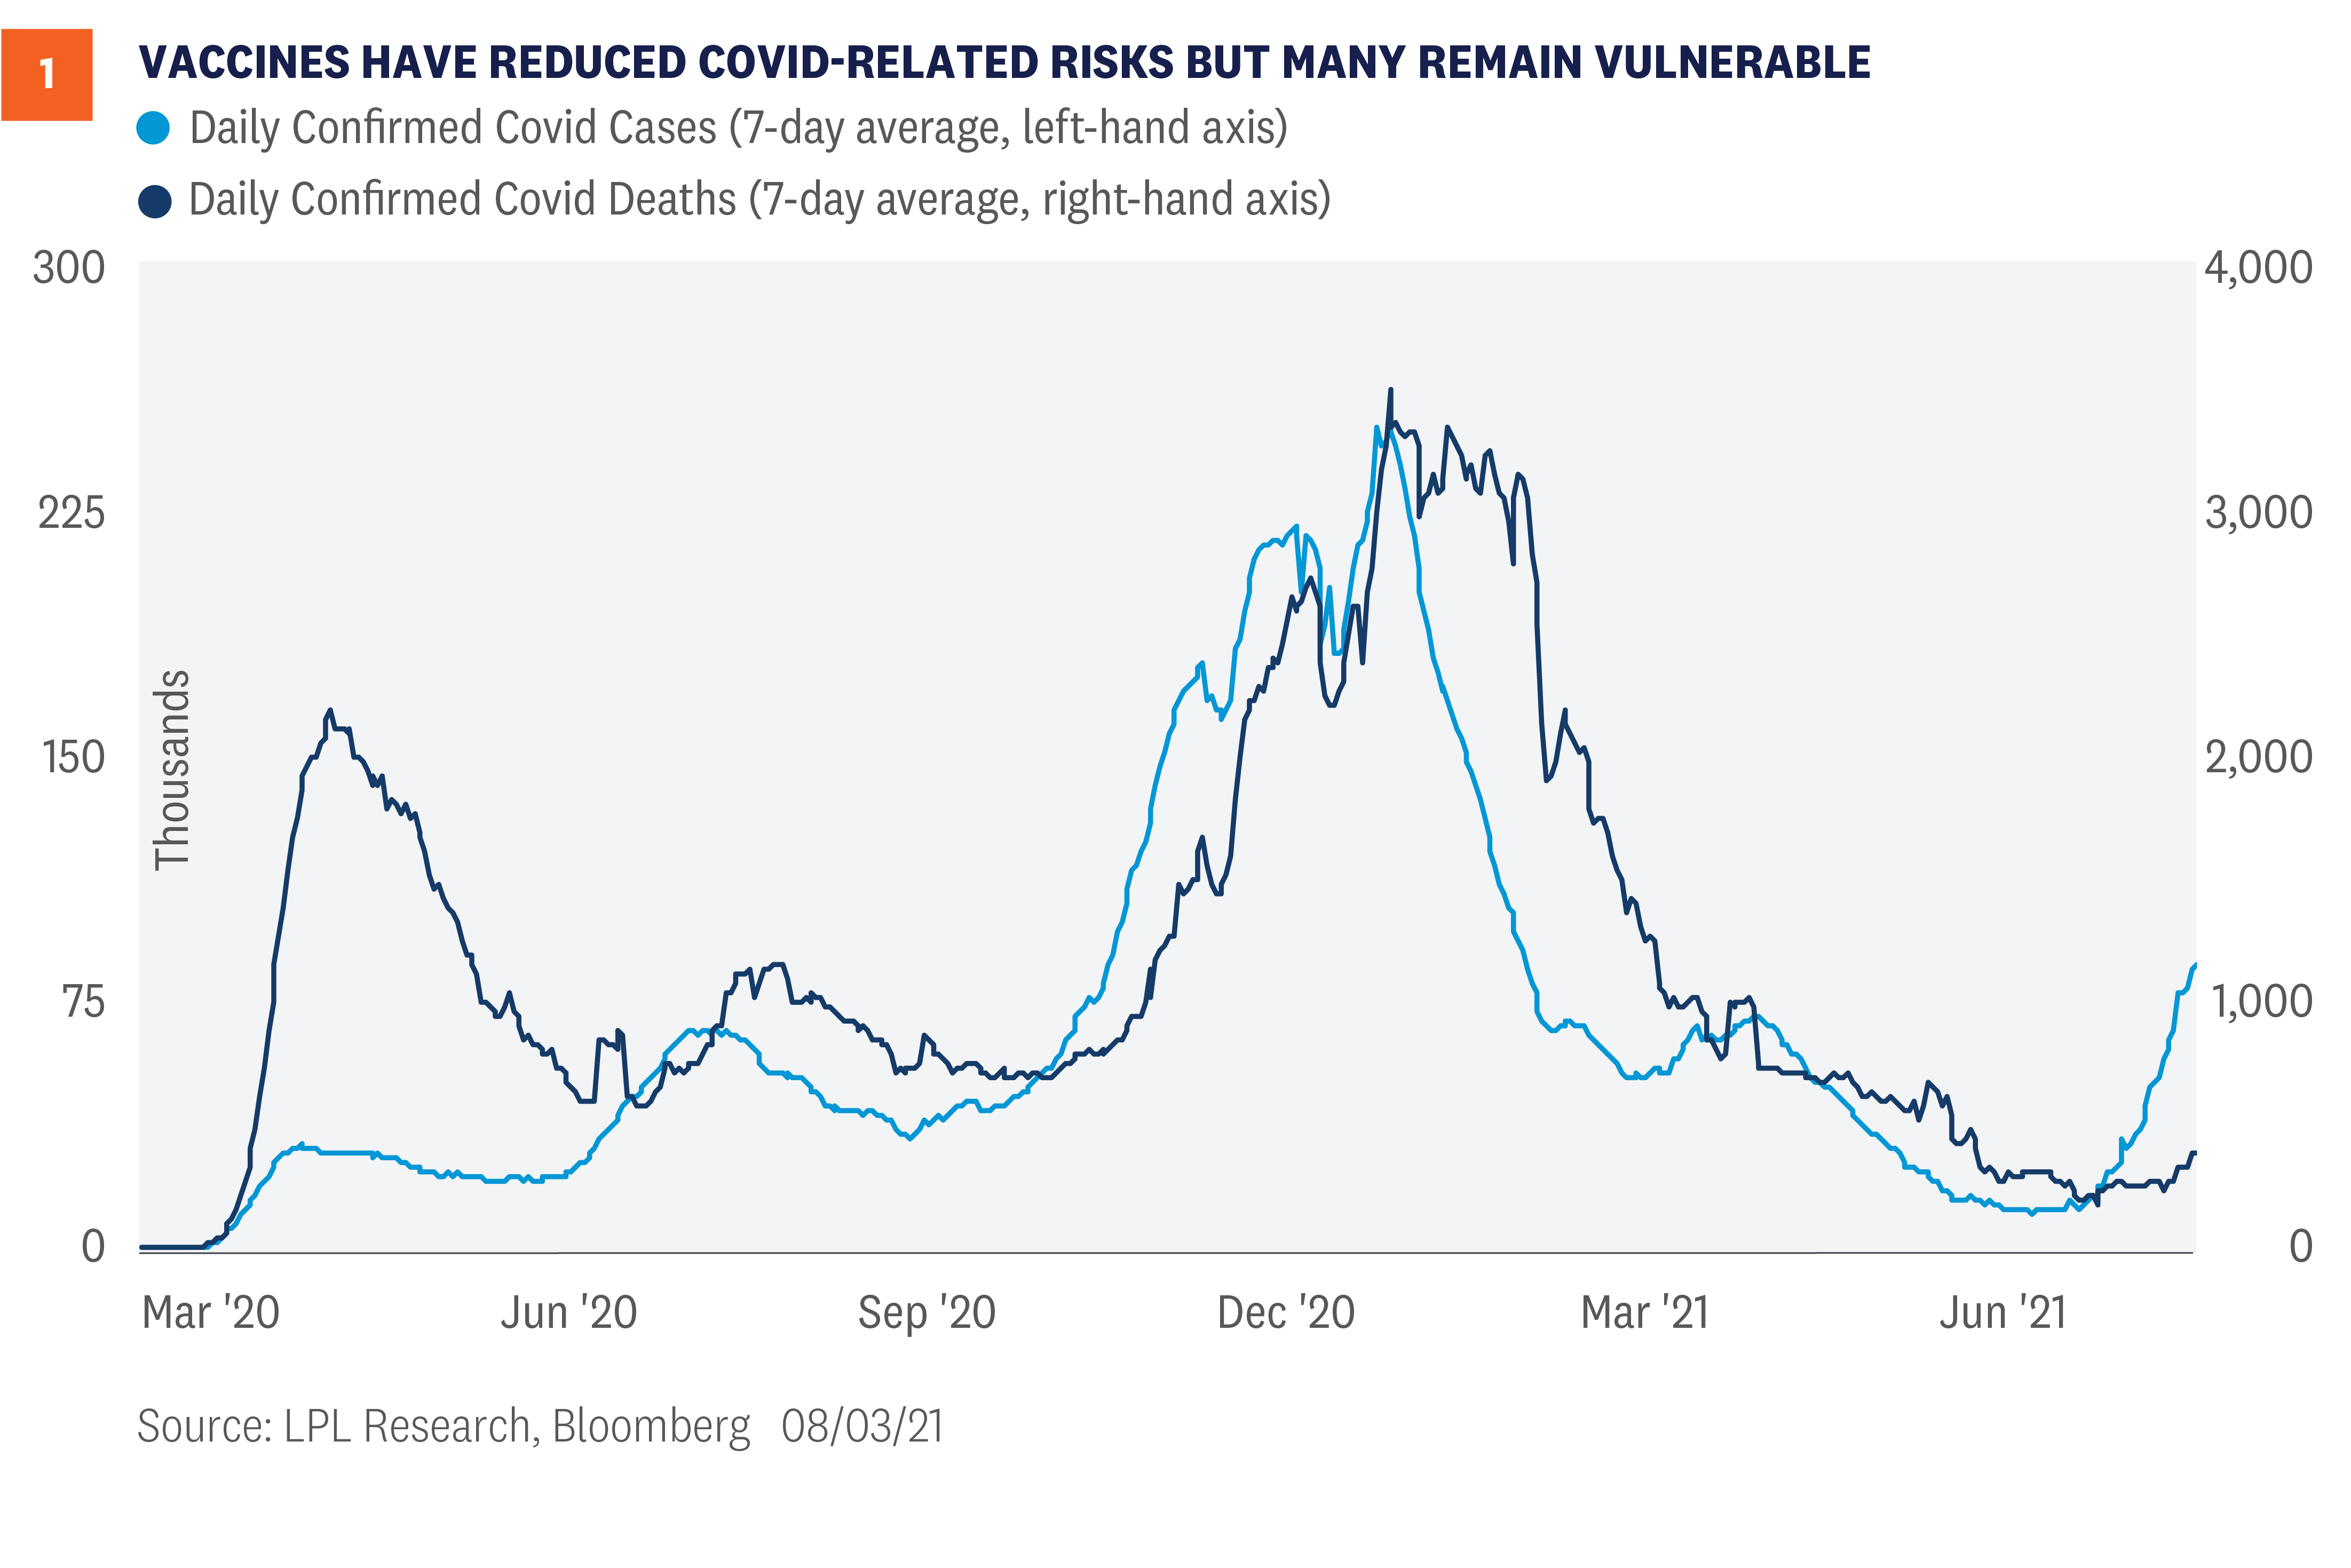
The highly transmissible Delta variant of COVID-19 now makes up an overwhelming majority of the new cases in the U.S., bringing with it a rise in cases and hospitalizations. Widespread vaccine distribution and distancing measures have helped limit the variant’s impact, but we could still see some drag on economic growth as some restrictions are reintroduced and consumers potentially become more cautious. While we may see an increase in market volatility due to the Delta variant, we believe the S&P 500 is still likely to see more gains through the end of the year.
The Delta Variant May Drag On Economic Growth
Despite the increased transmissibility of Delta and the increased health threat for those who aren’t vaccinated, our understanding of the measures needed to contain COVID-19 is in an entirely different place than it was in 2020. Above all else, we have not just one but several vaccines, which drastically reduces the risk from the variant, although it can’t completely eliminate it. We understand the effectiveness of masks in limiting transmission. Treatments have improved. We also know that the virus is not easily transmitted by touching surfaces—especially with simple good practices around handwashing—limiting the need for certain restrictions. Because of that, deaths from COVID remain near the lowest level of the pandemic despite the pick-up in cases [Figure 1]. Much of that is due to the vaccines’ ability to limit serious cases, though health risks remain high for those who aren’t vaccinated. We are also seeing some strain on healthcare systems in regions with low vaccination rates. Our view has consistently been that governments should, and generally will, impose restrictions only to the degree necessary to protect the most vulnerable and keep our healthcare system from getting overwhelmed. There’s not a clean, scientific answer to exactly what that point is, but there is a solid set of guidelines. If individuals, businesses, and officials use those guidelines as appropriate for their communities, there will still likely be some added drag on economic growth—but we think it will be manageable, with the drag still outweighed by the on-going rebound. How much added drag? The most recent gross domestic product (GDP) reading for the U.S. put economic activity back above the level where it was before the pandemic. That does raise the bar. We do think third-quarter GDP forecasts could fall a few percentage points, the lost growth being pushed back into late 2021 and early 2022. But even if the impact was so strong that we saw modest economic contraction, which we view as unlikely, we would expect the economy to bounce back quickly.
New Restrictions, Supply Chains Sources of Concern
Any drag on economic growth would likely come from a few key sources: While we are unlikely to see a new wave of widespread shutdowns in the U.S., there may be added restrictions. The effectiveness of vaccines and our increased understanding of how to contain COVID will limit the need for restrictions, especially with vaccination rates rising again and vaccines available to anyone eligible who wants them. The strongest measures will probably be around mask mandates and social distancing, with stronger restrictions confined to localities where they are most needed. Even without government mandates, there will still be changes in individual behavior that may slow the rate of economic growth. Changes in individual behavior due to safety concerns will probably have a larger impact than government intervention. This will likely be especially true for those with young children who are not eligible for vaccinations and those who choose not to get vaccinated. Behavioral changes may slow the recovery in the job market in particular if the changing environment places additional childcare demands on parents or raises workplace safety concerns. We are likely to see an extension of supply chain disruptions. While the impact from Delta could slow demand growth, it may have a bigger impact on the supply side. Some countries where vaccine availability has been low have already imposed added restrictions, which could limit factory activity, exacerbate shortages, and create added price pressures. The economy has been slowly starting to work its way through supply/demand imbalances, but this may negate some of the progress, putting a temporary cap on growth.
Market-Positive Elements of Response May Gain Traction
Not all the news around the Delta variant has been bad from a market perspective. We may even be close to the inflection point where much of the bad news has been priced in and markets start looking past the Delta variant’s growth impact. Markets tend to lead the economy, not the other way around. Think about where we were on March 23, 2020, when the S&P 500 bottomed. Granted, we are in a very different place right now, as we have not seen a substantial Delta-related pullback yet, only rotation toward some less risky areas of the market, so there may still be bumps ahead. But we think any dips in stock prices are likely to be short-lived and it may not even take all that much clarity before we see some rotation back to the market sectors that would benefit most from reopening. Vaccination rates are starting to rise again. While some people may still choose to remain unvaccinated, it’s hard to ignore the extreme risk disparities between those who are vaccinated and those who aren’t as Delta has spread. Rising cases, as well as efforts of local officials, have led to vaccination rates starting to rise again, and we recently crossed the threshold of 70% of U.S. adults having received at least one vaccination shot. Delta’s greater transmissibility does mean “herd immunity” will be harder to achieve, but there does seem to be progress. Europe is showing improvement. Europe is providing a model of the ability of countries with high vaccination rates to limit the impact of the Delta variant. Europe has been battling Delta longer than the U.S. and seems to be turning the corner, reinforcing that we do have the tools to limit the spread of the variant without large economic disruptions. While it’s clear that the Delta variant could create significant added economic strain if left unchecked, it’s also becoming increasingly clear that we have the tools to contain the impact while still protecting the economy. Stimulus is more likely to stay in place or even expand. Equity markets almost universally like stimulus even if there might be potential long-term negative consequences. Delta has already pushed back expectations of the first Federal Reserve rate hike. Market-based expectations had been pulled forward to 2022 as U.S. growth surprised to the upside, but have now been pushed back again to 2023. The Biden administration’s stimulus plans may also receive greater support if the economy stumbles due to Delta, and we could even see some added COVID-oriented measures. Even if the stimulus comes with a long-term cost, it is likely to be viewed as market positive in the near term due to the added safety net it provides. Reopening momentum will be difficult to reverse. Even with heightened restrictions in place, individuals and businesses will be reluctant to completely lose reopening momentum. Of course, it’s not completely in their control, but we think there will be a bias toward not being overly cautious, and less of a need where vaccination rates are high. There is rising concern over the Delta variant, and people will be more cautious on average, but we are very unlikely to return to the levels of fear seen in 2020.
Short-Term Concerns are Real But Market Impact Likely Limited
Despite the greater transmissibility of the Delta variant and increased health risk for those who are not vaccinated, we think the U.S. and global economy will continue to expand over the rest of the year. We maintained our 2021 U.S. growth forecast at 6.25 – 6.75% in our Midyear Outlook 2021: Picking Up Speed even as forecasts were rising and that decision now seems prudent, but we also see no need to lower it. Global vaccine distribution has a long way to go, but we’re making steady progress. Meanwhile, vaccine availability is high in the U.S. and our understanding of how to contain the virus has deepened substantially since the outbreak began in early 2020. There are still increased risks to growth and we may see patches of market volatility, but we believe any meaningful dip in equity markets should still be viewed as an opportunity to add risk for appropriate investors, and may also provide opportunities to rebalance portfolios toward reopening beneficiaries. Read previous editions of Weekly Market Commentary on lpl.com at News & Media. Barry Gilbert, CFA, Asset Allocation Strategist, LPL Financial ______________________________________________________________________________________________ IMPORTANT DISCLOSURES This material is for general information only and is not intended to provide specific advice or recommendations for any individual. There is no assurance that the views or strategies discussed are suitable for all investors or will yield positive outcomes. Investing involves risks including possible loss of principal. Any economic forecasts set forth may not develop as predicted and are subject to change. References to markets, asset classes, and sectors are generally regarding the corresponding market index. Indexes are unmanaged statistical composites and cannot be invested into directly. Index performance is not indicative of the performance of any investment and do not reflect fees, expenses, or sales charges. All performance referenced is historical and is no guarantee of future results. Any company names noted herein are for educational purposes only and not an indication of trading intent or a solicitation of their products or services. LPL Financial doesn’t provide research on individual equities. All information is believed to be from reliable sources; however, LPL Financial makes no representation as to its completeness or accuracy. US Treasuries may be considered “safe haven” investments but do carry some degree of risk including interest rate, credit, and market risk. Bonds are subject to market and interest rate risk if sold prior to maturity. Bond values will decline as interest rates rise and bonds are subject to availability and change in price. The Standard & Poor’s 500 Index (S&P500) is a capitalization-weighted index of 500 stocks designed to measure performance of the broad domestic economy through changes in the aggregate market value of 500 stocks representing all major industries. The PE ratio (price-to-earnings ratio) is a measure of the price paid for a share relative to the annual net income or profit earned by the firm per share. It is a financial ratio used for valuation: a higher PE ratio means that investors are paying more for each unit of net income, so the stock is more expensive compared to one with lower PE ratio. Earnings per share (EPS) is the portion of a company’s profit allocated to each outstanding share of common stock. EPS serves as an indicator of a company’s profitability. Earnings per share is generally considered to be the single most important variable in determining a share’s price. It is also a major component used to calculate the price-to-earnings valuation ratio. All index data from FactSet. Please read the full Midyear Outlook 2021: Picking Up Speed publication for additional description and disclosure. This research material has been prepared by LPL Financial LLC. Securities and advisory services offered through LPL Financial (LPL), a registered investment advisor and broker-dealer (member FINRA/SIPC). Insurance products are offered through LPL or its licensed affiliates. To the extent you are receiving investment advice from a separately registered independent investment advisor that is not an LPL affiliate, please note LPL makes no representation with respect to such entity. Not Insured by FDIC/NCUA or Any Other Government Agency | Not Bank/Credit Union Guaranteed | Not Bank/Credit Union Deposits or Obligations | May Lose Value
RES-850750-0721 | For Public Use | Tracking # 1-05176386 (Exp. 08/22)
Several policy-related risks loom in September and October that may lead to an increase in market volatility. The debt ceiling needs to be raised (likely by mid-October), the government needs to be funded to avoid a shutdown by the end of September, and the Democrats are trying to pass two major spending bills and will need to provide greater clarity on tax increases over the next several weeks. We believe the greatest risks come from the debt ceiling and taxes, but expect neither to have much near-term impact on the general trajectory of the bull market. There’s always something going on in Washington, but with summer behind us, policy debates are heating up with an unusual number of high-profile policy issues looming for Congress and President Joe Biden in September and October. Those include the debt ceiling; the fate of the bipartisan infrastructure bill; clarity and potential progress on the much larger American Families Plan (AFP) spending package emphasizing Democratic priorities (also known as the human infrastructure bill); and, not to be forgotten, simply funding the government. These very well could be the peak policy months of President Biden’s first term, akin to the months leading up to the passage of the Affordable Care Act under President Barack Obama and the Tax Cuts and Jobs Act under President Donald Trump. This week we break down what market participants should be watching, possible sources of risk, and our expectations.
Looming Deadlines Forcing the Action
September and October aren’t important policy months simply because there’s a lot going on—looming deadlines are forcing the action. Keep in mind that Congress is notorious for not acting until the last possible moment and even pushing back deadlines whenever it can, as different members of Congress try to squeeze one more concession out of negotiations. This will create a lot of noise and increased uncertainty, but is unfortunately the norm for how Congress operates. While every maneuver may be of genuine political interest, as an investor, it’s important not to get too caught up in Congressional drama. Here’s a quick overview of where we are right now and what may be coming next:
Bipartisan infrastructure bill – The bill, which includes about $550 billion in new spending over the next eight years and $1.2 trillion in total spending, was passed by the Senate on August 10. Since then, Democratic House leadership has been holding out on a vote, using the delay for political leverage to pull moderates on board for the larger spending package. On August 24, in exchange for voting in favor of the budget resolution needed for the AFP to progress, moderate Democrats were given a non-binding promise on infrastructure reaching the House floor for vote by September 27.
American Families Plan – The August 24 budget resolution was needed for Democrats to pass a large spending package under the reconciliation process, which requires only a simple majority to pass in the Senate. The budget resolution set a soft target of the bill moving out of committee by September 15. To date, Democrats have remained vague on how the bill will be paid for, but the House Ways and Means Committee will need to provide a concrete proposal by September 15, assuming the timeline holds up. In other words, by September 15 we’ll start getting clarity on who is getting taxed and how much. That’s when things start to get interesting.
Funding the government – A partial government shutdown takes place on October 1 unless a continuing resolution is passed to fund the government. That resolution would fund the government only for a limited specified time, at which point we do it all again. Often, the continuing resolution is made part of another bill that is hard to vote against, or it could get passed as part of the AFP using the reconciliation process
The debt ceiling – At some point, if Congress does not raise the debt ceiling the government would technically default on its current obligations. We don’t know exactly when that point will be, but it will likely come in mid-October. The government has been using extraordinary measures since early August to conserve cash so it can meet its obligations for as long as possible.
With deadlines forcing the action, what will market participants be watching? Primarily the debt ceiling and taxes. The two present contrasting risk profiles. Congress is extremely unlikely to let the U.S. default on its debt since it would likely have significant negative consequences for markets and the economy. On the other hand, Congress is very likely to raise taxes, driven by (slim) Democratic majorities in both chambers. But, based on history the immediate market impact is likely to be negligible, with the biggest risk around the hit to corporate earnings due to a higher corporate tax rate. On the other hand, taxes help contain deficits—it’s how you pay for what you spend, and for deficit hawks it’s preferable to borrowing. Best to spend wisely and tax lightly, but no president since 1960 has been able to achieve that except Bill Clinton. In the absence of that approach, paying for at last some of what you spend may be preferable to pushing the national debt even higher.
Debt Ceiling
The debt ceiling is the maximum amount of debt that the Treasury Department can issue. The Treasury uses the money it borrows to pay its obligations. The amount is set through Congress and has been regularly increased as needed over the years. The consequences of not raising the debt ceiling are far from trivial. Not only would the U.S. government not be able to cover its expenses, it would also default on its debt—which could send shockwaves throughout the financial system. Through a bipartisan budget act in 2019, Congress suspended the debt ceiling through July 31, 2021, which allowed the government unfettered access to capital markets. As seen on the chart, when the suspension was enacted, total debt outstanding was $22 trillion—but current debt levels have risen to $28.4 trillion, which is the new debt ceiling level [Figure 1]. The debt ceiling will need to be raised soon or the U.S. Treasury will likely run out of its “extraordinary measures” to fund government activities. Treasury Secretary Janet Yellen recently said this would likely occur in October.
Congress can seemingly address the debt ceiling in one of two ways: increase the debt ceiling or suspend the debt ceiling again. Accordingly, Congress could insert a debt ceiling increase in the AFP bill, which would require only 50 votes, or suspend the debt ceiling for a certain period of time, similar to what happened in 2019, which would require 60 votes. Democrats could also attach a debt ceiling suspension to a stopgap government-funding bill, which may attract crossover support. But that route may be challenging. Forty-six of the 50 Republican senators have pledged that they will not vote for any increase in the debt ceiling. If the debt ceiling isn’t resolved, the U.S. government would technically default on its contractual obligations. Bond markets have been relatively sanguine about the prospects of a U.S. default, but we are starting to see yields move higher on Treasury bills maturing in late October and early November. Unless resolved, as we get into October, we could see short maturity Treasury yields move higher still as the prospects of non-repayment, however slight, get priced into the market. U.S. bond market investors have taken for granted the government’s ability and willingness to pay its debt. While its ability to repay its obligations is not in question, playing politics with the debt ceiling complicates the picture of the country’s willingness to pay its debts—which is part of why the credit rating on U.S. debt was lowered by Standard & Poor’s in 2011. While we think Congress is extremely likely to act in time and either raise or suspend the debt ceiling, these games of political chicken can introduce volatility to markets in the meantime.
Greater Clarity on Taxes is Coming
There are few near-term market risks from the planned spending in the AFP, although there may be longer-term risks due to rising debt and higher structural tax levels. But markets tend to like stimulus. There may be some market risks, however, around how the spending is paid for, which will be a combination of borrowing and taxes. Raising taxes has never been politically popular, and so far, Democrats have been somewhat vague about where the tax revenue would come from. But if Democrats are going to try to pass the infrastructure and AFP bills in September or October, they need to begin getting into specifics on taxes in the next week. President Biden has proposed increasing the corporate tax rate from 21% to 28%, though we see the rate ending up closer to 25%. At that rate, we estimate that S&P 500 earnings per share (EPS) would be reduced by about 5% in 2022. We believe there’s roughly 70% odds that these tax increases will go into effect starting January 1, 2022. As a result, our 2022 S&P 500 EPS forecast of $218 carries some downside risk. Individual taxes on upper-income individuals are also likely to go higher as the Democrats attempt to raise more than $1 trillion in tax revenue to fund a portion of their agenda. The Biden administration has proposed taking the top tax rate on ordinary income to 39.6% from 37%, and capital gains and taxes on those who earn more than $1 million to a maximum of 43.4% from the current 23.8%. While a capital gains tax increase on wealthy individuals is likely, we would expect an eventual compromise to land at a rate near 28%, which would put the total effective rate—including the 3.8% Affordable Care Act tax—at 31.8%. It’s logical to think impending tax increases could cause market volatility at some point as the path to those tax hikes becomes clearer. So far, stock prices have seemingly ignored this risk. We offer two primary reasons for that. First, these tax increases have been widely expected for quite some time. Remember, President Biden campaigned on them. And second, as we discussed in our Midyear Outlook 2021 publication, markets have generally held up well after past tax increases, including corporate and individual (though the sample size is small). Those who do not expect these tax hikes to be passed may also be providing some support for stocks. It won’t be easy to get moderate and progressive Democrats on the same page to pass such significant legislation with razor-thin majorities in the House and Senate.
Policy-Related Market Volatility Likely to be Short Lived
Whether the bi-partisan infrastructure bill and the AFP are passed as two bills or one (which is still a possibility), we think we are likely to see a total package of $2-2.5 trillion in new spending, funded by a combination of debt and $1-1.5 trillion in new taxes over approximately 10 years. We may see some pick-up in policy-related volatility as the legislative process moves forward around the two spending bills, funding the government, and the debt ceiling—but we believe most of the impact has been largely priced in. Depending on where corporate taxes end up, we could see some energy come out of the bull market, but it doesn’t lead to a substantive change in our outlook. For those who follow politics closely, the next several weeks will probably garner heavy interest. For market participants, though, we believe the priority will be to tune out the noise and not panic over deadline drama. The fundamental backdrop for the economy remains strong and corporate America continues to demonstrate extraordinary resiliency—and ultimately that’s what drives the stock market. Read previous editions of Weekly Market Commentary on lpl.com at News & Media. Barry Gilbert, PhD, CFA, Asset Allocation Strategist, LPL Financial
Lawrence Gillum, CFA, Fixed Income Strategist, LPL Financial
Jeff Buchbinder, CFA, Equity Strategist, LPL Financial ______________________________________________________________________________________________ IMPORTANT DISCLOSURES This material is for general information only and is not intended to provide specific advice or recommendations for any individual. There is no assurance that the views or strategies discussed are suitable for all investors or will yield positive outcomes. Investing involves risks including possible loss of principal. Any economic forecasts set forth may not develop as predicted and are subject to change. References to markets, asset classes, and sectors are generally regarding the corresponding market index. Indexes are unmanaged statistical composites and cannot be invested into directly. Index performance is not indicative of the performance of any investment and do not reflect fees, expenses, or sales charges. All performance referenced is historical and is no guarantee of future results. Any company names noted herein are for educational purposes only and not an indication of trading intent or a solicitation of their products or services. LPL Financial doesn’t provide research on individual equities. All information is believed to be from reliable sources; however, LPL Financial makes no representation as to its completeness or accuracy. US Treasuries may be considered “safe haven” investments but do carry some degree of risk including interest rate, credit, and market risk. Bonds are subject to market and interest rate risk if sold prior to maturity. Bond values will decline as interest rates rise and bonds are subject to availability and change in price. The Standard & Poor’s 500 Index (S&P500) is a capitalization-weighted index of 500 stocks designed to measure performance of the broad domestic economy through changes in the aggregate market value of 500 stocks representing all major industries. The PE ratio (price-to-earnings ratio) is a measure of the price paid for a share relative to the annual net income or profit earned by the firm per share. It is a financial ratio used for valuation: a higher PE ratio means that investors are paying more for each unit of net income, so the stock is more expensive compared to one with lower PE ratio. Earnings per share (EPS) is the portion of a company’s profit allocated to each outstanding share of common stock. EPS serves as an indicator of a company’s profitability. Earnings per share is generally considered to be the single most important variable in determining a share’s price. It is also a major component used to calculate the price-to-earnings valuation ratio. All index data from FactSet. Please read the full Midyear Outlook 2021: Picking Up Speed publication for additional description and disclosure. This research material has been prepared by LPL Financial LLC. Securities and advisory services offered through LPL Financial (LPL), a registered investment advisor and broker-dealer (member FINRA/SIPC). Insurance products are offered through LPL or its licensed affiliates. To the extent you are receiving investment advice from a separately registered independent investment advisor that is not an LPL affiliate, please note LPL makes no representation with respect to such entity. Not Insured by FDIC/NCUA or Any Other Government Agency | Not Bank/Credit Union Guaranteed | Not Bank/Credit Union Deposits or Obligations | May Lose Value
RES-868874-0821 | For Public Use | Tracking # 1-05189436 (Exp. 09/22)
The term stagflation has been circulating increasingly in the financial media as inflation readings have risen sharply in recent months. The term is often associated with the 1970s, which saw runaway inflation—largely driven by sky-high energy prices—and lackluster economic growth. Stagflation and a return to the weak equity markets of the 1970s would be understandably scary. However, when looking at the data, we remain skeptical that either runaway inflation or low growth are right around the corner, much less both at the same time.
The Misery Index
One way to gauge stagflation is to calculate what is commonly referred to as the Misery Index—inflation plus unemployment. As shown in [Figure 1], the Misery Index today is nowhere near the extreme levels of the 1970s. In fact, the level of “misery” is very close to the long-term average near 10—despite the highest inflation readings we’ve seen in over a decade. “We don’t believe the current environment is anything like the stagflation experiences of the 1970s,” explained LPL Financial Director of Research Marc Zabicki. “We think much of the elevated inflation readings we’re seeing now are transitory and related to pandemic bottlenecks and material shortages. Meanwhile, the economic reopening and massive stimulus should provide a strong one-two punch to keep economic growth well above average through 2022.”
Price Competition Anchors Inflation
The irony of inflation concerns is that the Federal Reserve has been trying, without success, for the past decade to stimulate inflation to its 2% long-term target. We believe there are several structural considerations at play that have—and will continue to—put downward pressure on prices over the medium- to long-term. Demographics and global trade are two of those considerations. We also believe that more acute price competition is an important variable that can keep prices contained. In our view, the ubiquitous use of the internet has indeed raised the price consciousness of the consumer. It has streamlined the price discovery process and has served to shift the pricing balance of power from producers to consumers. After all, consumers can sift through products, services, and their pricing on their smartphones without leaving their home. Just a decade ago, what consumers could purchase on the internet may have been limited to small-ticket commodity items, electronics, and books. Now the list of goods and services for which consumers can comparison shop includes nearly everything from new vehicles to airline tickets to homes to rent or buy. In this context, it is little surprise to us that inflation has been benign for years, and we anticipate price pressures could again subside once coronavirus-related supply/demand imbalances run their course.
Market Inflation Expectations Peaked In May
Much of the runaway inflation case had centered on skyrocketing commodity prices, a valid concern to be sure. However, since May nearly every commodity that was causing alarm has seen a significant decline. Lumber prices? Down more than 70%. Copper prices? Down 15%. Even crop prices such as corn and soybeans have fallen significantly over the past few months. As they often say, the cure for high prices is high prices. We also take comfort in the fact that the bond market actually agrees with our view of transitory inflation. If one was simply looking at recent economic reports or reading media headlines, they might be surprised to realize that the market isn’t actually looking for more extreme inflation readings. By looking at the difference between what bond traders pay for inflation-protected Treasuries and plain vanilla nominal Treasuries, we can get a good idea of what the market’s expectations for inflation actually are. Market-implied inflation expectations or “breakevens” rose rapidly from extremely low levels last year. However, a funny thing happened after the release of the April Consumer Price Index (CPI) report in early May: Inflation expectations actually fell. And those expectations have continued to fall despite higher subsequent readings. Currently, market participants are estimating inflation to be less than 2.5% annualized over the next five years, more than 30 basis points (0.30%) lower than the expectation in early May.
Growth Outlook is Favorable
The other key component of the Misery Index is the unemployment rate, a sort of proxy for growth and economic health. The unemployment rate is not yet back to its pre-pandemic levels, but the most recent jobs report showed that the economy added nearly a million jobs in July, bringing the unemployment rate down to 5.4%. We see the potential for further job gains as schools reopen and unemployment benefits expire for a significant amount of the unemployed in early September.
That said, after the boosts from the reopening and stimulus pass, the U.S. economy may resume its pre-pandemic growth trend in the neighborhood of 2% real gross domestic product (GDP) growth. Bloomberg’s survey of economists points to just 2.3% real GDP growth in 2023, after 4.2% next year. Given the limited population growth in the United States, demographic headwinds as baby boomers retire, and low immigration rates, the opportunity for stronger economic growth than that may be limited, and that slower growth makes higher inflation all the less likely.
Conclusion
Stagflation is understandably a concern. Low growth and high inflation lead to a situation where the vast majority of people become poorer in real terms. However, we simply do not believe the evidence indicates this to be a likely scenario. While prices are not likely to outright decline and create deflation, we expect recent inflation readings to moderate and growth to remain at a solid speed over the next year. We believe this helps bolster the case for stocks to add to gains through the remainder of 2021.
For more information, please read our Midyear Outlook 2021: Picking Up Speed.
Read previous editions of Weekly Market Commentary on lpl.com at News & Media. Jeff Buchbinder, CFA, Equity Strategist, LPL Financial
Ryan Detrick, CMT, Chief Market Strategist, LPL Financial
Scott Brown, CMT, Senior Analyst, LPL Financial ______________________________________________________________________________________________ IMPORTANT DISCLOSURES This material is for general information only and is not intended to provide specific advice or recommendations for any individual. There is no assurance that the views or strategies discussed are suitable for all investors or will yield positive outcomes. Investing involves risks including possible loss of principal. Any economic forecasts set forth may not develop as predicted and are subject to change. References to markets, asset classes, and sectors are generally regarding the corresponding market index. Indexes are unmanaged statistical composites and cannot be invested into directly. Index performance is not indicative of the performance of any investment and do not reflect fees, expenses, or sales charges. All performance referenced is historical and is no guarantee of future results. Any company names noted herein are for educational purposes only and not an indication of trading intent or a solicitation of their products or services. LPL Financial doesn’t provide research on individual equities. All information is believed to be from reliable sources; however, LPL Financial makes no representation as to its completeness or accuracy. U.S. Treasuries may be considered “safe haven” investments but do carry some degree of risk including interest rate, credit, and market risk. Bonds are subject to market and interest rate risk if sold prior to maturity. Bond values will decline as interest rates rise and bonds are subject to availability and change in price. The Standard & Poor’s 500 Index (S&P500) is a capitalization-weighted index of 500 stocks designed to measure performance of the broad domestic economy through changes in the aggregate market value of 500 stocks representing all major industries. The PE ratio (price-to-earnings ratio) is a measure of the price paid for a share relative to the annual net income or profit earned by the firm per share. It is a financial ratio used for valuation: a higher PE ratio means that investors are paying more for each unit of net income, so the stock is more expensive compared to one with lower PE ratio. Earnings per share (EPS) is the portion of a company’s profit allocated to each outstanding share of common stock. EPS serves as an indicator of a company’s profitability. Earnings per share is generally considered to be the single most important variable in determining a share’s price. It is also a major component used to calculate the price-to-earnings valuation ratio. All index data from FactSet. Please read the full Midyear Outlook 2021: Picking Up Speed publication for additional description and disclosure. This research material has been prepared by LPL Financial LLC. Securities and advisory services offered through LPL Financial (LPL), a registered investment advisor and broker-dealer (member FINRA/SIPC). Insurance products are offered through LPL or its licensed affiliates. To the extent you are receiving investment advice from a separately registered independent investment advisor that is not an LPL affiliate, please note LPL makes no representation with respect to such entity.
Not Insured by FDIC/NCUA or Any Other Government Agency | Not Bank/Credit Union Guaranteed | Not Bank/Credit Union Deposits or Obligations | May Lose Value
RES-867001-0821 | For Public Use | Tracking # 1-05181664 (Exp. 08/22)

 But COVID-19-related supply chain issues and materials and labor shortages may push costs up and pressure corporate profit margins in 2022. Several companies have already warned of such pressures ahead of thirdquarter earnings season (more on that in an upcoming commentary). As a result, we are forecasting S&P 500 earnings growth of 6% in 2022—$218 per share after $205 per share in 2021, shown in Figure 2. However, higher corporate taxes, which we see as likely, may eat into much of those earnings gains in 2022. So, while we anticipate stocks will get some help from earnings in 2022 and expectations for more earnings growth in 2023, uncertainty is clearly high.